
Yesterday I came across https://free-for.dev site and spent half of evening on scrolling and searching on what might be helpful to me. And I found one!
There are handful of services that generate charts based on data that you provide in the URL. Yes, I know, this is an old idea and even Google had such a service but they decommissioned it. At the same time other services still exist and we can use them in order to chart something pretty simple in a fast way. We don't need to write JavaScript code and use external libraries, we can just prepare cryptic URL and see the results immediately!
Here is the example that I did. A year or two ago, I started to use conventional commits in my pet project. As each commit contains a type of the change, I noticed that I rarely add features but I do a lot of refactoring and tasks of a "chore" type. I have a feeling that I like improving code more than adding something really useful. But this is just a "feeling", could we prove that I lost my focus with numbers?
Sure thing, we can even visualize this! So, we need to parse commits, group them by their type and plot data as a chart. I'm going to use https://quickchart.io for that.
The main page has an example of a bar graph that I chose for the task. We know a URL format and we only need to provide data. Let's ask git to give us all the commits since the last release and output only their subjects (the fist line of a commit):
$ git log --format=%s 0.4.2..HEAD
style: update a year in copyright.
build(pom.xml): update hibernate-validator to 6.0.18.Final
refactor: replace a custom validator implementation by @Email with "regexp" parameter.
Leave only the first word that is a type of a commit.
$ git log --format=%s 0.4.2..HEAD | sed -E 's/^([^:( ]+).*/\1/'
style
build
refactor
As you have noticed we used the regular expression to extract from the beginning of the line a sequence of any characters until we reach a colon, a bracket or a space. If all the commits are follow to the convention, we won't have a space and I added it to handle old commits.
Note that we passed -E option and enabled extended regular expressions. This was made for readability because it simplifies the regexp as we don't have to escape parentheses and a plus sign.
We can use uniq command for grouping the results but first we have to sort them:
$ git log --format=%s 0.4.2..HEAD | sed -E 's/^([^:( ]+).*/\1/' | sort
build
build
chore
uniq can be used to find only unique elements or duplicates, but we want to count the occurrences:
$ git log --format=%s 0.4.2..HEAD | sed -E 's/^([^:( ]+).*/\1/' | sort | uniq -c
   2 build
   4 chore
   6 refactor
We have already got all we need but we can't use it as-is within a JSON that Quick Chart accepts.
Chart labels should be a comma-separated list of the single-quoted strings:
'build','chore','refactor'
Numbers of the commits also should be comma-separated:
2,4,6
How we can perform such transformations? The plan is to pick a particular column and join the lines by a separator. We won't use regular expressions here as there is a little simpler approach with awk:
$ DATA="$(git log --format=%s 0.4.2..HEAD | sed -E 's/^([^:( ]+).*/\1/' | sort | uniq -c)"
$ echo "$DATA" | awk '{print $1}'
2
4
6
$ echo "$DATA" | awk "{printf(\"'%s'\n\",\$2)}"
'build'
'chore'
'refactor'
'style'
awk process input line-by-line and splits each line by whitespaces. Every column is accessible by a variable named as a number of a column. The code within the curly braces is being executed against each line from an input. In the case with labels we used double quotes to be able output single ones. Because of that we had to escape double quotes and a dollar sign.
Note also that we saved commits statistic into the variable and now can parse data as many times as we want without accessing a disk and parsing again the same data.
Now, we can glue values together and use a comma to separate them. paste does exactly what we need:
$ echo "$DATA" | awk '{print $1}' | paste -s -d, -
2,4,6,2
$ echo "$DATA" | awk "{printf(\"'%s'\n\",\$2)}" | paste -s -d, -
'build','chore','refactor','style'
Option -s tells to glue infinitely as we don't know how many values input would have.
The last step is to construct a URL. Here is the final code:
$ DATA="$(git log --format=%s 0.4.2..HEAD | sed -E 's/^([^:( ]+).*/\1/' | sort | uniq -c)"
$ COMMITS="$(echo "$DATA" | awk '{print $1}' | paste -s -d, -)"
$ TYPES="$(echo "$DATA" | awk "{printf(\"'%s'\n\",\$2)}" | paste -s -d, -)"
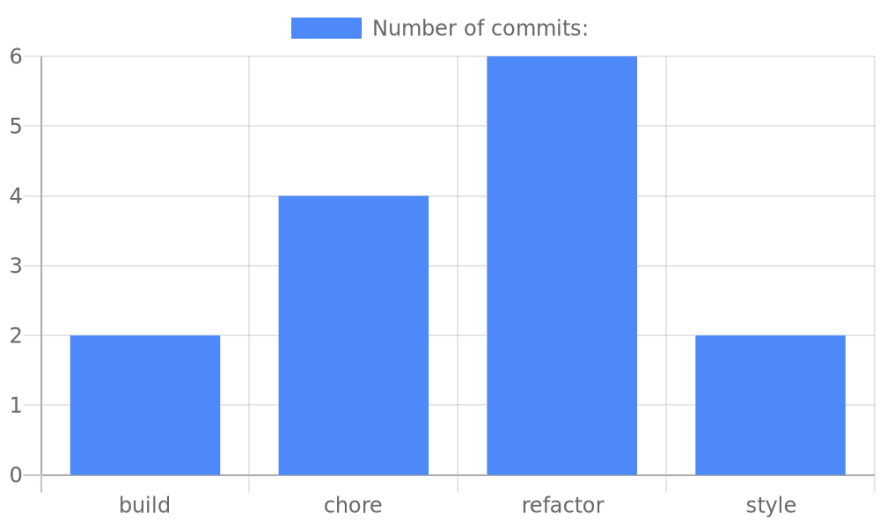
$ printf "https://quickchart.io/chart?c={type:'bar',data:{labels:[%s],datasets:[{label:'Number of commits:',data:[%s]}]}}\n" "$TYPES" "$COMMITS"
https://quickchart.io/chart?c={type:'bar',data:{labels:['build','chore','refactor','style'],datasets:[{label:'Number of commits:',data:[2,4,6,2]}]}}
It took just 4 lines of code and we've got a nice chart that clearly shows what type of work has been done recently and where developer's focus was.
Of course there many things that could be improved but we've got something working right here right now. I added a couple of improvements to the code (validation, take into account non-conventional commits, etc), put it into the cc-chart.sh script and published on GitHub:
 php-coder
/
conventional-commits-chart
php-coder
/
conventional-commits-chart
Generate a chart with distribution of the commits by types
I had a fun playing with this and I hope that this will be useful to you!

Top comments (0)