I recently took the Chrome Dev Tools course on Frontend Masters, by Jon Kuperman. The course was excellent: very well taught, good pace and loaded with stuff I didn't know about. Here is a recap of the stuff I didn't know about, for my future self and for you all:
Elements tab
- You can change the property in the css column, not only the attributes or values. screenshot
- You can change the html tag *and the class, ids, etc) in the left column: screenshot
-
+signs allows to add a new element: - html tags are droppable
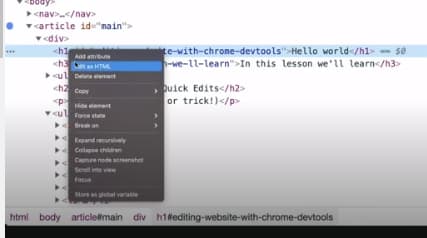
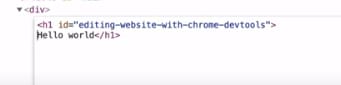
- Click on
Edit as HTMLto edit it in the elements tab:
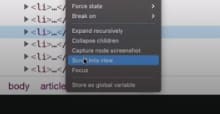
- Scroll into view
Clicking
hon an element hides it from the screen and you can delete it from the DOM.Simulate state, by clicking on
:hovon the css column:

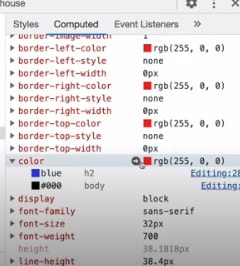
- CSS computed style, which tells you which selector was more specific:
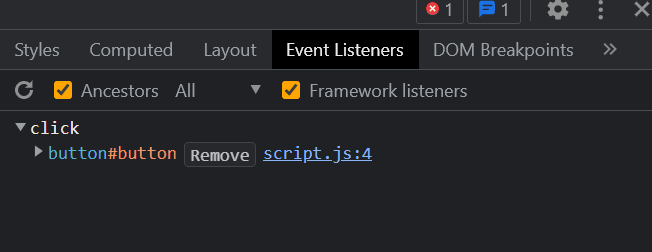
- Selecting an html element, the
Event Listenerstab will tell you which events are attached to it:
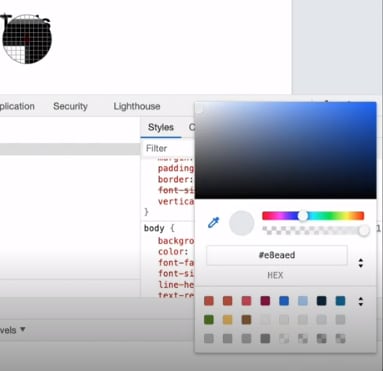
- Click on a color value in a css property, and it gives you a bunch of color options: selector, color palette, colors in the page, eye dropper, etc.
- Shift click on a color, and changes the format of the color:
![]()
Network tab
- Cog shows more options, like capture screenshots.
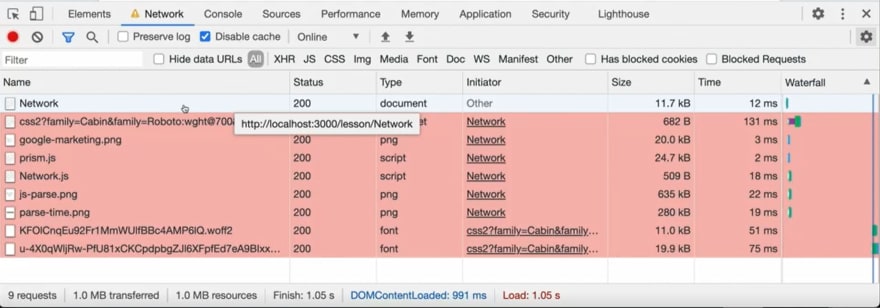
- Holding
shifton an item will turn all the things this item called red:
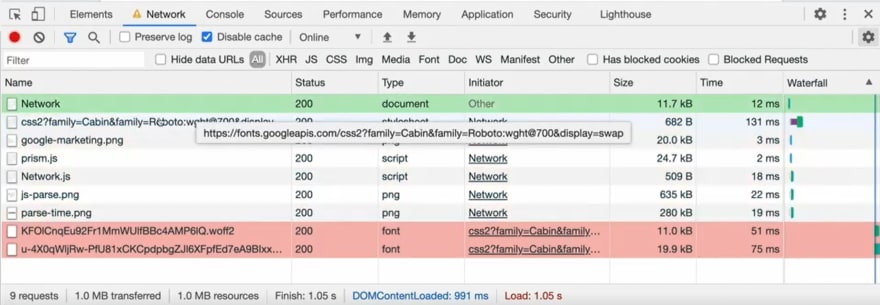
- And if that item was called by something, it will turn green:
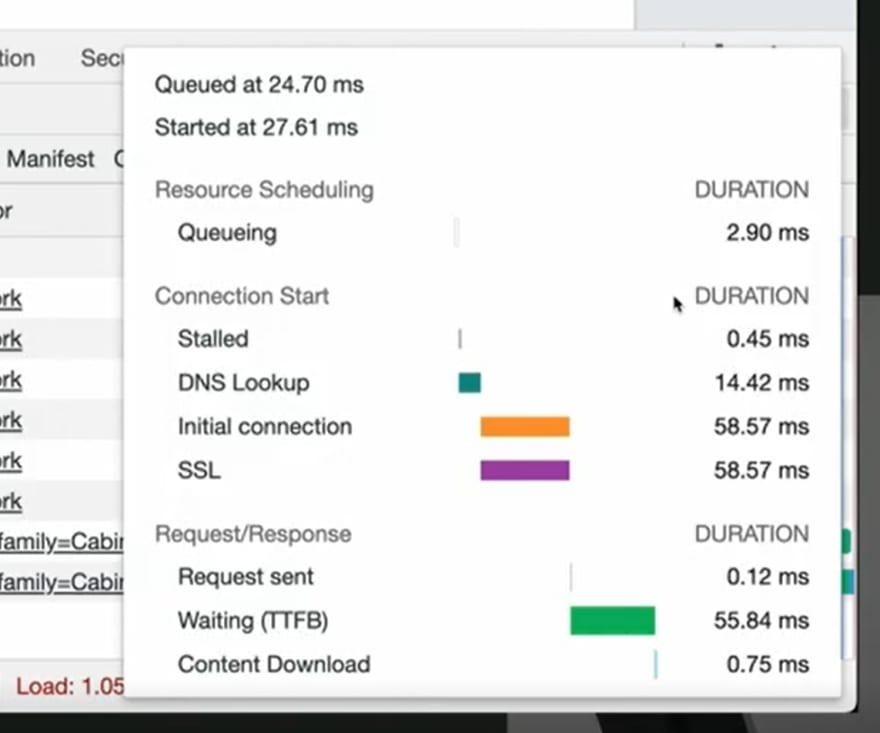
- Hover over
waterfallcolumn element shows more details (docs here):
- Right click in any column header, will give more options:
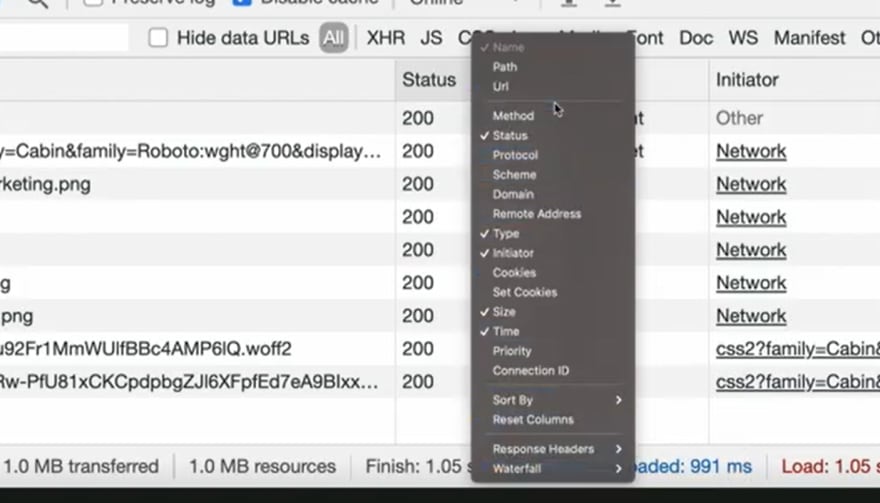
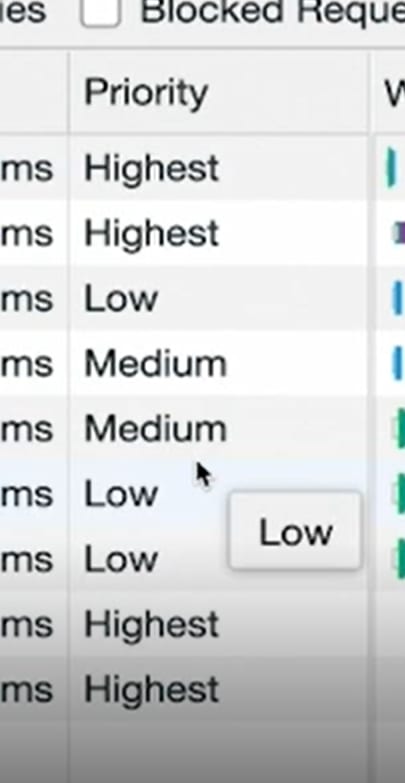
-
Prioritycolumn shows which priority was given to the network call by the browser:
Performance tab
- Record and stop. Advise: keep record as small as possible.
- 3 sections:
i. Graph: frames per second, CPU and Network.
ii. Middle one: many sections
iii. Summary
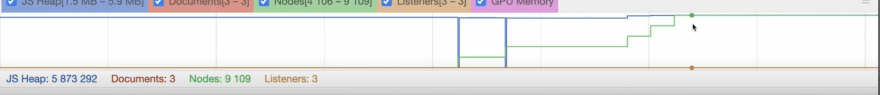
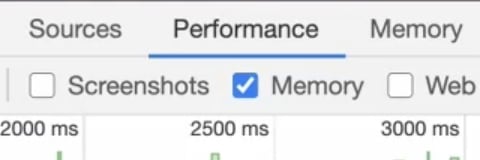
- Memory, clicking on memory checkbox:
- What can slow down a website?
i. Backend: database, server, network, compression
ii. Frontend: large bundles, too many files, images or JS not async, images too large, images uncompressed (lossless image compression), unused JS or CSS, CSS in document body, not using browser
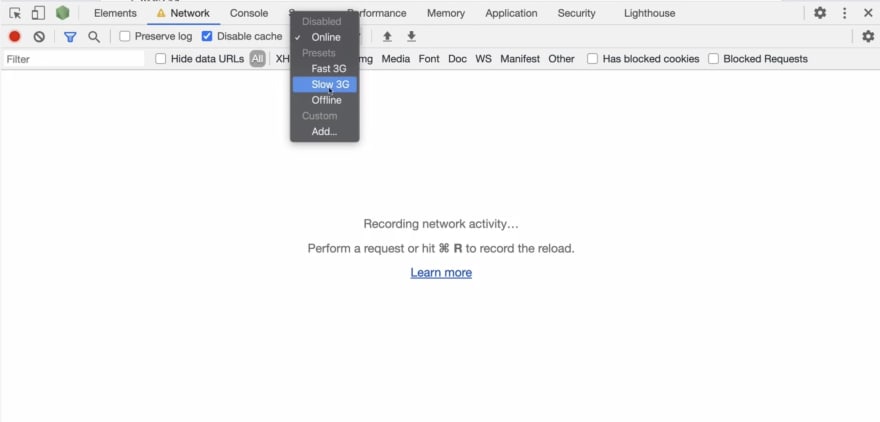
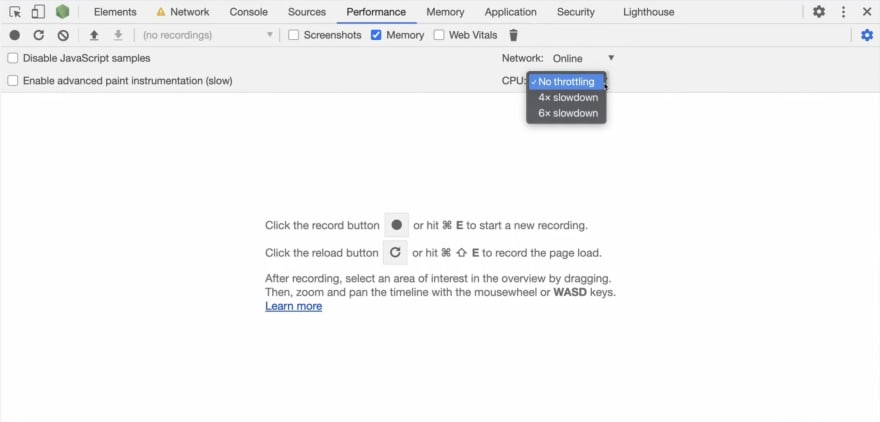
- You can throttle the loading speed in Network tab and Performance tab:
Console tab
- Click on html element in Element tab, and type $0 in the console to see the element. 0 is shortcut for the last element clicked. And you can manipulate that element, like so:
- Console history:
$0,$1, etc -
performance.mark('something'),.measure, etc. will time the time between them in theperformancetab (timingssection). No need forconsole.time()andconsole.timeEnd()anymore. There is a bunch of stuff that can be done with the Performance API.
Security tab
- Overview on security, pretty straightforward.
Sources tab
- Workspaces, so changes persist in disk.
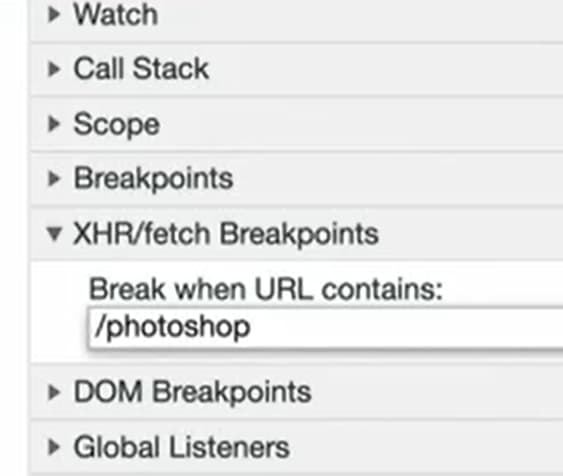
- XHR/fetch breakpoint, only when the url contains certain text:
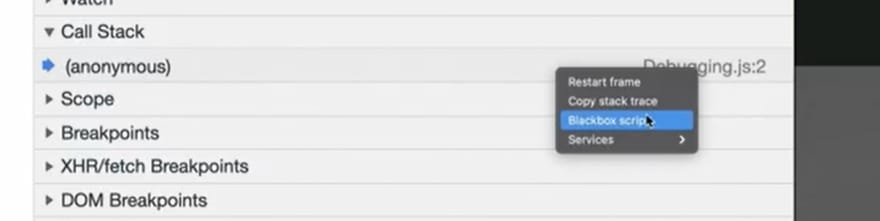
- You can
blackboxa script in the call stack, so you don't see it anymore. Helpful for react or whatever stack calls that are irrelevant for the debugging:
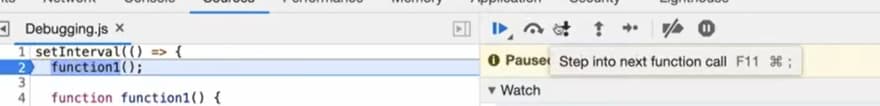
-
Step overvsstep intonext function call:
Memory tab
- Memory consumption
- Link to Garbage Collection article in MDN
- More information on garbage collection can be found in its MDN article
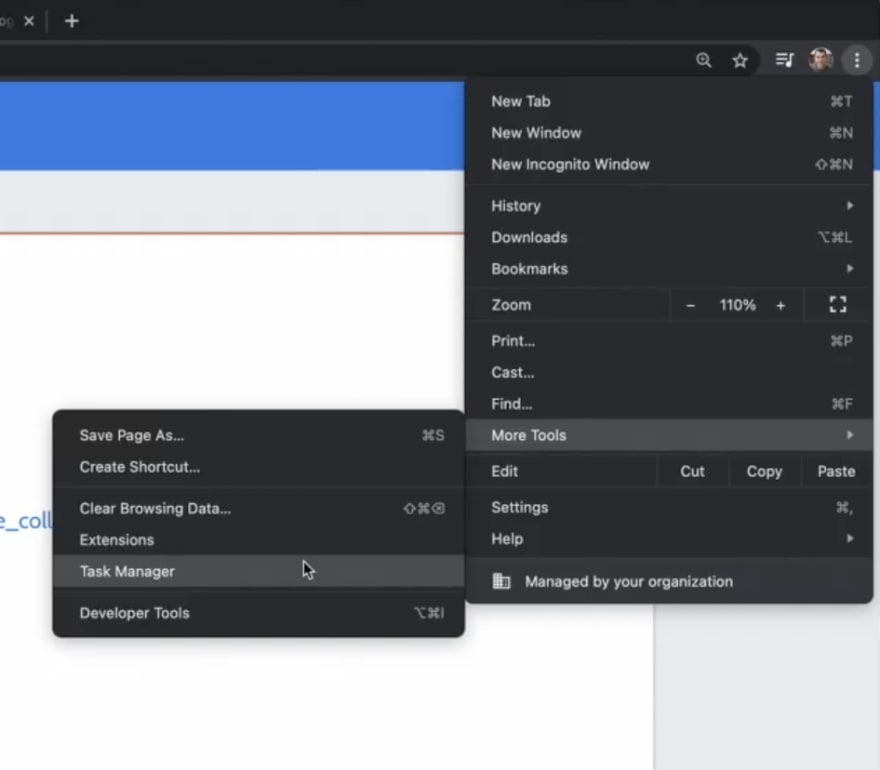
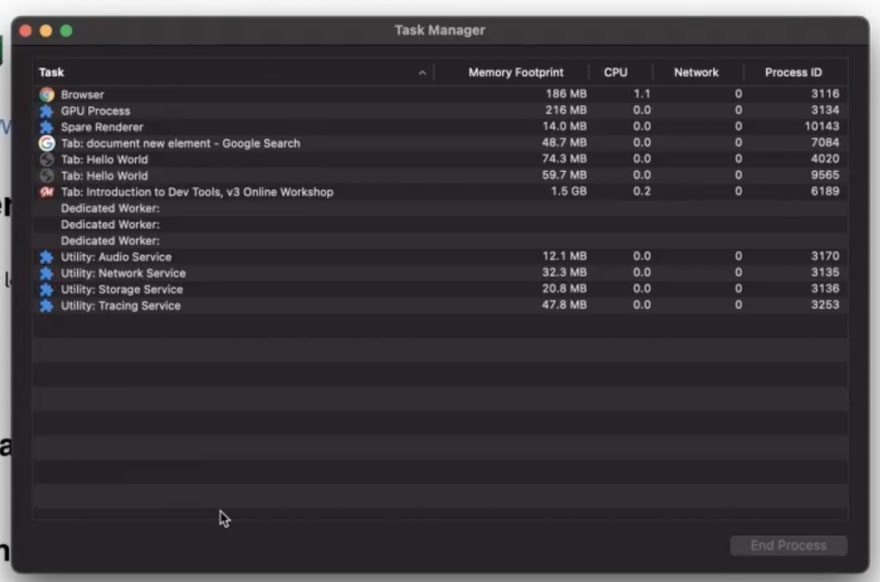
- Chrome
Task manager- not part of dev tools, but Chrome:
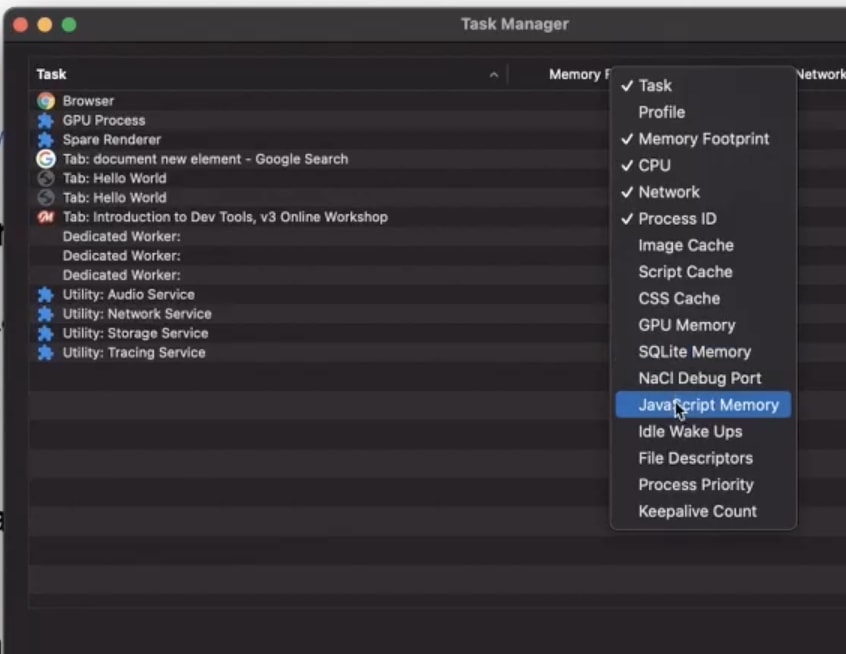
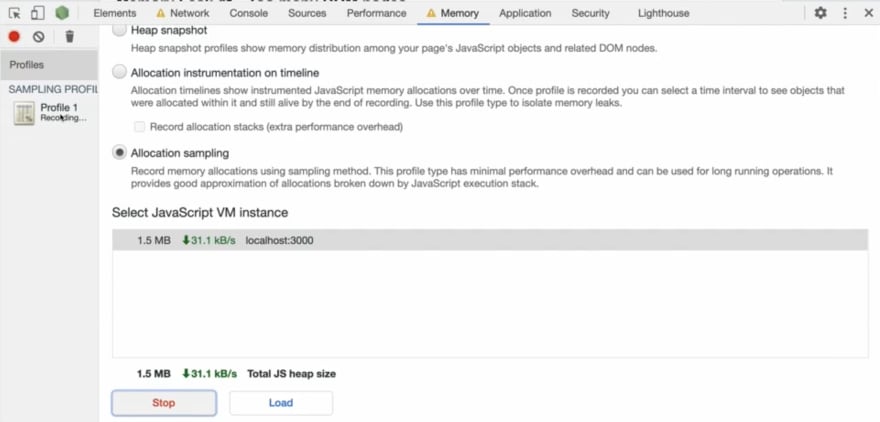
- 3 options for viewing memory:
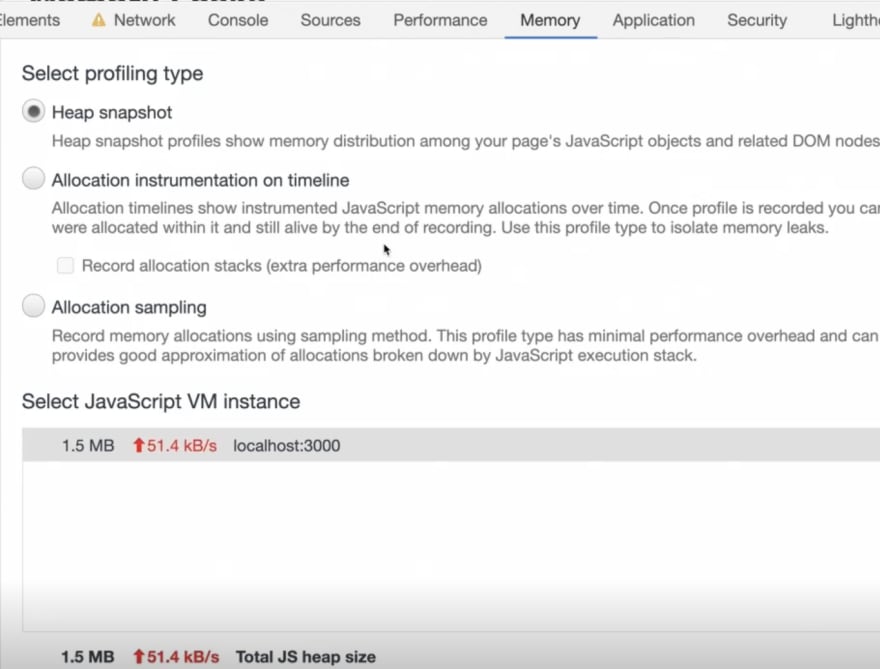
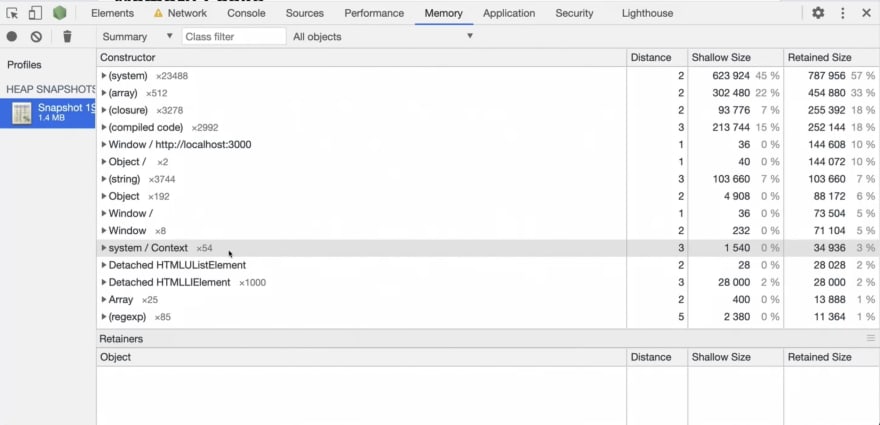
i. Heap snapshot - grabs what's in memory at the time. You can see type of item, distance (distance from the window object, the global), shallow size (how big is the thing) and retained size (size of the object plus the graph it retains)
ii. Allocation overtime - you can see when memory is allocated overtime

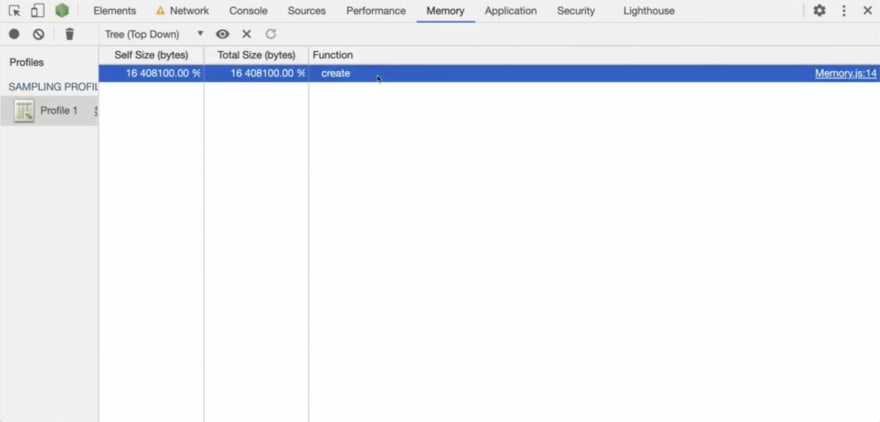
iii. Allocation sampling, kinda answers the question (ok, I have a memory leak, but what do I do with it?). It will tell you what function or code is causing this.
So, tldr on memory management: 1) task manager 2) performance tab, to get visual reference 3) memory tab.
Application tab
- Storage, service worker, clear site data.
Lighthouse tab
- Runs also in local.
- Tests a bunch of stuff: performance, accessibility, SEO, etc. Check it out!
Misc. Some other cool stuff:
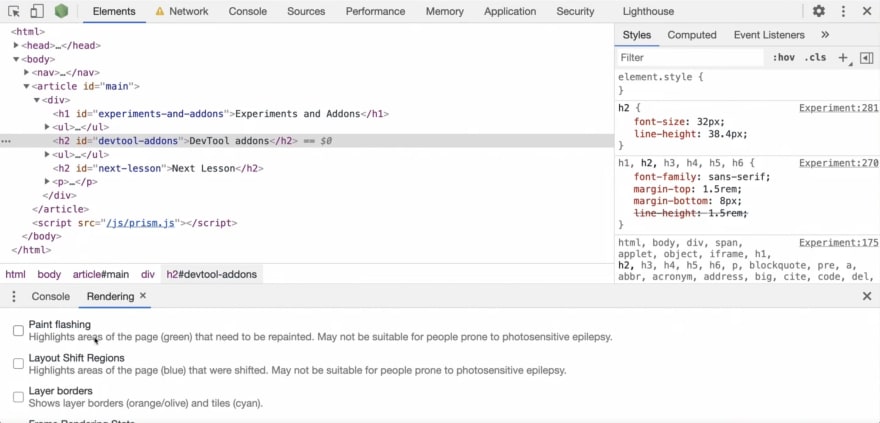
- Rendering tab in
Elementstab. It has options likePaint flashingand maaaany more:

Top comments (0)