Written by Kristine Jetzke
This blog post is part 1 in the series “Tips & Tricks for better log analysis with Kibana”. The other parts can be found here Part 2 and here Part 3.
While working with different teams in various companies I have noticed some recurring issues when it comes to using Elasticsearch and Kibana for log analysis. In this blog post series I will give some easy-to-apply tips that will make working with your logs easier.
Some of the common issues:
Missing Log Entries: Logs can no longer be inserted because they are incompatible with the schema of the existing logs. Thus, they are missing in the system and the whole system is not in a usable state. Because if you can’t look up logs in your logging system, what do you need it for...?
Unusable Data: All logs exist but it’s not possible to get the required information from them. The data is indexed in a way that makes it impossible to get this information.
Bad Performance: It takes a long time for searches to complete. Sometimes it might be because of a lack of knowledge and people just don’t use the best query for their needs. But other times the data is not even indexed in a way that allows for performant searches. So it takes much longer to look something up than necessary and people become frustrated.
Bad Usability: It’s difficult to remember how to perform certain searches. Data is indexed in a way that requires complicated queries. Thus, people have cheat sheets with queries that they copy paste from. Or they fall back to the tedious process of scanning logs manually for certain keywords.
I will cover the four topics in three blog posts. This blog post and the next one will focus on solving the first two issues; the last one on improving performance and usability.
Disclaimer
This article assumes that you’re familiar with the following core concepts of Elasticsearch and Kibana:
All of the examples were done with Elasticsearch 6.7.0. Most of them are based on the logs sample dataset that comes with Kibana.
Why it’s important to specify field types
Let’s start with an example to illustrate why it’s important that Elasticsearch knows the types of your fields.
The logs sample dataset that this example is based on contains access logs and one entry looks like this:
  {
        "referer": "http://twitter.com/success/patrick-forrester",
        "clientip": "153.196.107.153",
        "response": "200",
        "message": "153.196.107.153 - - [2018-08-01T19:44:40.388Z]
  \"GET /beats/metricbeat/metricbeat-6.3.2-amd64.deb HTTP/1.1\" 200 6329 \"-\" \"Mozilla/5.0 (X11; Linux i686) AppleWebKit/534.24 (KHTML, like Gecko) Chrome/11.0.696.50 Safari/534.24\"",
        "request": "/beats/metricbeat/metricbeat-6.3.2-amd64.deb",
        "extension": "deb",
        "url":
  "https://artifacts.elastic.co/downloads/beats/metricbeat/metricbeat-6.3.2-amd64.deb",
        "memory": null,
        "host": "artifacts.elastic.co",
        "utc_time": "2018-08-01T19:44:40.388Z",
        "agent": "Mozilla/5.0 (X11; Linux i686) AppleWebKit/534.24 (KHTML, like Gecko) Chrome/11.0.696.50 Safari/534.24",
        "ip": "153.196.107.153",
        "bytes": 6329,
        "timestamp": "2019-03-27T19:44:40.388Z"
    }
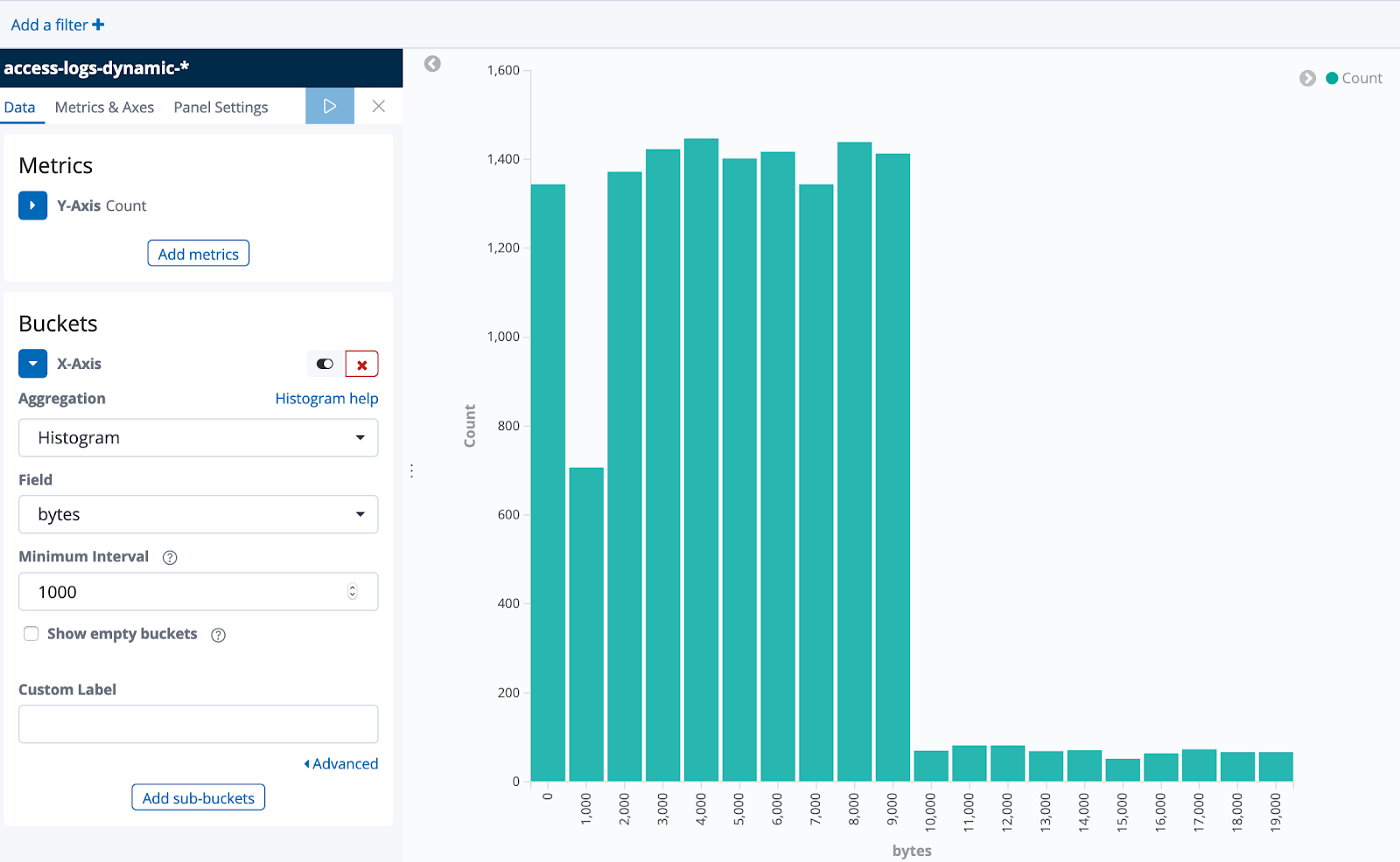
Imagine that a developer works on the application that produces these logs. One day a research task comes in where she needs to find out how much data is returned for certain requests. She looks into the log data and sees the bytes field which contains the size of the response. “Ah! I can create a histogram based on this data” she thinks, imagining something like this:
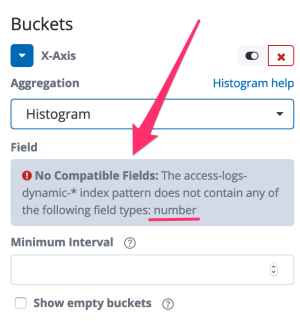
She opens a new visualization in Kibana but when she wants to select the bytes field, Kibana shows an error:
Why? Because histograms can only be applied on fields with numeric values and apparently there is not a single numeric field, not even bytes. This is where the Elasticsearch mapping comes into play. It defines - among other things - the type of the fields.
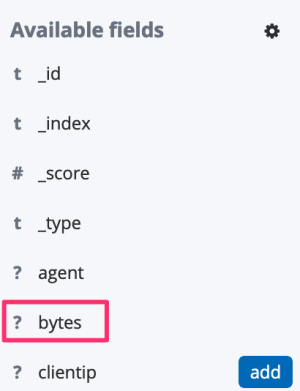
The developer opens the Discover page of Kibana and has a look at the field types:
The bytes field is marked with a question mark, meaning that Kibana does not know which type it is. How can she fix it? By adding the field with the correct type to the mapping via the PUT Mapping API:
"properties": {
     "bytes" : {
          "type" : "long"
     }
}
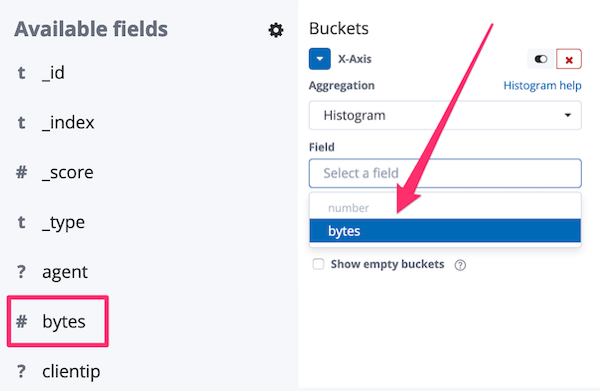
After refreshing the Kibana index pattern, the bytes field is now considered a number (s. image on the left) and she can select it for the histogram (s. image on the right), resulting in the visualization shown at the beginning of the section.
You might be wondering why bytes was not considered a number in the first place. This is a good question. Because by default Elasticsearch will automatically detect the type of each field and would have correctly detected that 6329 is a number. This is called dynamic field mapping. In the example above bytes was not detected automatically as a number because I turned off the dynamic detection completely. While this led to unusable data initially I will show in the next section why it makes sense to turn it off.
Why dynamic field mapping is not always a good idea
Let’s assume that our developer works on another application with logs that look like this:
{
    "timestamp" : "2019-04-12T00:00:02.52Z",
    "logger"    : "UserService",
    "level"     : "info",
    "userId"    : 12345678
}
With the dynamic field mapping setting enabled by default, Elasticsearch will correctly detect that timestamp is a date and logger and level are strings. userId will be considered a number, which is fine for now.
Some time later this log entry arrives:
{
    "timestamp" : "2019-04-12T03:23:50.52Z",
    "logger"    : "AnotherUserService",
    "level"     : "error",
    "userId"    : "123456ab"
}
And it will be rejected because of a mapping conflict.
{
  "error": {
     ...
     "type": "mapper_parsing_exception",
     "reason": "failed to parse field [userId] of type [long] in
document with id 'pZmzwGkBkbmNcrrUBIeG'",
     "caused_by": {
     "type": "illegal_argument_exception",
     "reason": "For input string: \"123456ab\""
     }
  }
  ...
}
The problem is that the userId in this entry is not a number and thus cannot be parsed into one. If all the logs for one service contain a non-numeric userId they will all get rejected. Thus, our poor developer won’t be able to access any logs from this service. Imagine this in an incident situation… Pretty bad, huh?
If the logs had arrived in a different order, nothing bad would have happened. The value 123456ab would have been detected as a string and the numeric value 12345678 would have been stored without any issue as a string as well.
Therefore, my main advice is to think about the structure of your logs beforehand and define all known common fields (e.g. userId, timestamp, logger, level, stacktrace, url, host) with the expected types. The Elastic Common Schema might be a good starting point. But what about the not so common fields? What happens if a new field is encountered?
To mitigate the risk of mapping conflicts happening because of new, previously unknown fields, I recommend one of the following two approaches:
- Ignore unknown fields, just store them without making them searchable. Add them afterwards to the mapping with the correct type if needed.
- Store unknown fields as the type you expect to match most new fields. If this type does not match, change it afterwards.
How these two approaches can be implemented and when to choose which one will be covered in the next blog post. Stay tuned!


Top comments (0)