❔ About
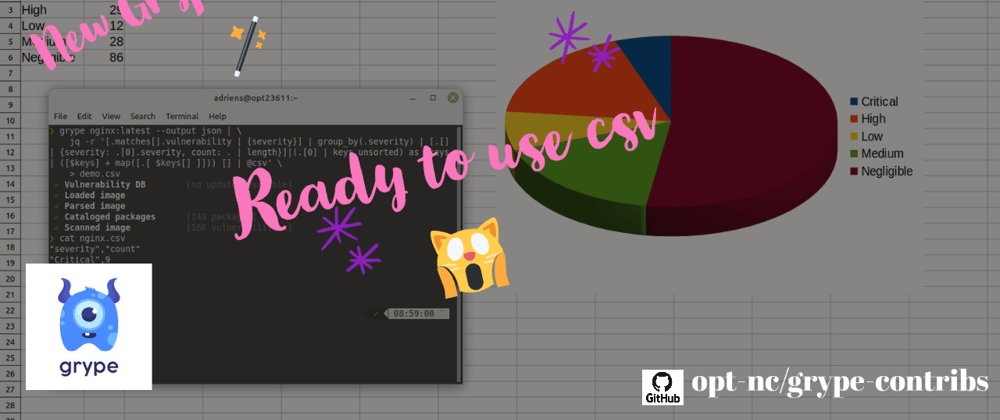
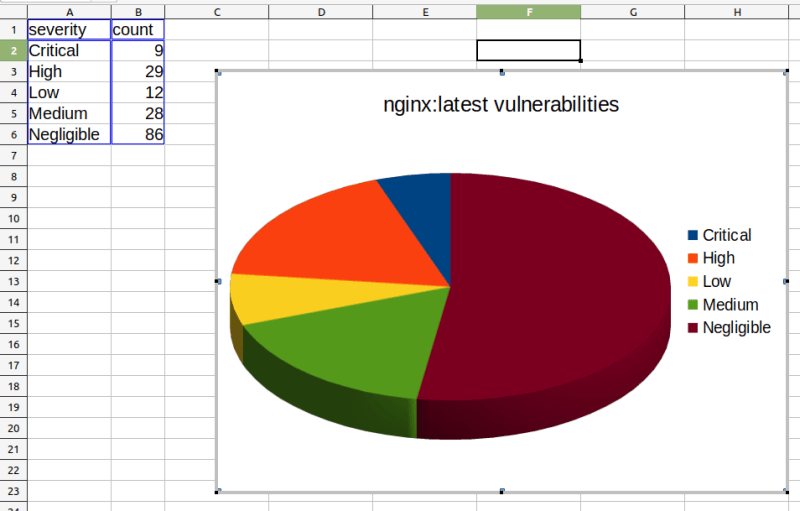
Often, when you talk about an image vulnerabilities, you need to get that kind of charts in a spreadsheet:
Therefore we created the following issue :
 🪄 Implement jq trick to group and count by severity
#8
🪄 Implement jq trick to group and count by severity
#8

Provide the jq query that takes in input a grype -o json command and returns
"Negligible",0
"Low",4
"High",10
see Group vulnerabilities by severity

🪄 The jq trick
Just follow (and bookmark) the following guidelines to enjoy the trick :

🍿 Showtime
Enough talk, let's see the trick in action :
🔖 Resources
opt-nc
/
grype-contribs
A set of resources around Anchore's grype tool
❔ About
The aim of this repo is to summarize some resources around Grype to take the best ouf this great tool.
🔖 Discover grype-contribs
To learn more about this project, take a glance at :

🧰 Prerequisites
For an optimal usage of these resources, you'll need :
git-
brewinstalled -
python3andpip
Install tools
brew tap anchore/grype
brew install grype
We'll use termgraph, "A command-line tool that draws basic graphs in the terminal," :
python3 -m pip install termgraph
Finally clone this repo :
gh repo clone opt-nc/grype-contribs
cd grype-contribs
📜 Templating
Since v0.42.0, and
its issue #724
it is possible to transform analysis report with templates.
This feature makes it possible to build nicely useable and highly customizable reports.


Oldest comments (4)
Great contrib @mbarre 🙌
Thanks for sharing this tip @adriens
Thanks for the feedback ;-p