
Introduction
Previously we discussed the absolute bare minimum to run BenchmarkDotNet in your CI pipeline. Your code builds, benchmarks are taken, and you have to drill down into the numbers.
But what if bad code was committed? A small change sneaks in, probably under tight deadlines, that suddenly makes your nice fast code run like treacle?
How would you know about - and more importantly stop - such horrors? That's what we'll try and address in this post.
As before, we're only talking pure code here, that is, your class methods and algorithms. APIs, services, applications are much more complex, and we haven't considered I/O. So let's keep it simple and just focus on the performance of pure code.
What this post will cover
- Discuss ways to stop builds upon degraded code performance
- Installing tools in a sandbox environment
- Collecting benchmark data for analysis
- Analysing results and breaking builds
What you'll need for this post
- .NET 7 SDK installed on your local machine
- A BenchmarkDotNet solution
- An IDE, such as VS, VS Code or Rider.
The simplest possible way to break a build...
...is, surprisingly, not a sledgehammer. It's even simpler than that.
For the vast majority of build platforms, to stop a build you normally need your script to return a non-zero return code. That age old trick is so simple and effective: it stops bad things dead in their tracks. So let's use that:
We want our benchmark analysis to return 0 on success and 1 on failure.
Easy! but this leaves us with a trickier problem.
How to detect performance has degraded?
You've got the stats from BenchmarkDotNet. You now need to monitor each build's performance results, or more accurately, detect deviance from accepted performance.
What is acceptable performance?
This is a very broad subject, and it's often difficult to put precise time limits on micro code performance. For much optimisation work, you'll be iteratively changing code so that performance should always improve with each commit. Therefore, you can stop optimising when the results are good enough.
So, as we often do not have absolute time requirements and we iteratively improve our performance as a matter of course, we'll take a broad view:
Accepted performance is the best recorded benchmark time
That leads us onto deviance.
Deviance from acceptable performance
Why do we want deviance and not absolutes? Because we cannot guarantee that repeated benchmark runs, even with a static codebase and the same infrastructure, will yield exactly the same time measurements over each iteration.
And as each build feeds many time-critical activities - user acceptance, security validation and the like - we don't want a tiny deviation to choke off this supply of new features.
How do we know what is an appropriate deviance is and how do we measure it? That's another very broad subject and depends entirely on your circumstances. For now, let's take a simple (& admittedly crude!) method just to illustrate the key point of stopping slow code getting into our main codebase.
Acceptable deviance, expressed as a percentage, falls in between
[baseline measurement] < [new measurement] < [baseline measurement + deviance%]
Here we're simply allowing some slippage from the best recorded time.
Please remember: the subject is extremely broad and this article is just an introduction to the subject. But for now, the main take-away point is: whatever the current performance, keep improving it and never degrade!
It seems we need a tool for this
You could build your own, but here's something from our own stables: a dotnet tool to detect deviance in BenchmarkDotNet results:
 NewDayTechnology
/
benchmarkdotnet.analyser
NewDayTechnology
/
benchmarkdotnet.analyser
A tool for analysing BenchmarkDotNet results
BenchmarkDotNet.Analyser (BDNA) is a tool for iteratively collecting and analysing BenchmarkDotNet data. It's distributed as a dotnet tool, so you can use it locally and on almost any CI platform. You just need .NET 7 installed.
BDNA is in beta and we want to continually improve it. We welcome bug reports and feature suggestions.
Installing
The latest version is distributed via Nuget.
For the remainder of this section, I'll lead you through installing BDNA in a sandbox environment so if you do get into any problems you can simply destroy the directory and start again without any side effects.
Create a new sandbox
The sandbox will be a directory on your local drive.
We won't be pushing this directory to source control in this article. But the same steps are used in a cloned local repository.
mkdir c:\projects\scratch\tools
cd
cd projects\scratch\tools
Create a tools manifest
The tools manifest is simply a version list of the repo's tools, to ensure version consistency and stability: just like your own project's package dependencies. As we want these tools installed locally we'll create a new manifest in our directory:
dotnet new tool-manifest
Globally installed .NET tools are very convenient: you install it once on your machine and keep updating as necessary. But they place nasty dependencies on your build platform, and there's no guarantee your team members will use exactly the same version. Locally installed tools provide consistency, and are installed to the local repository.
Install BDNA
All that's left now is to download and install BDNA:
dotnet tool install bdna
This will install the latest non-preview version. If you want to install a specific version, just give the version, say:
dotnet tool install bdna --version 0.2.263
BDNA packages are listed here.
Check that BNDA is correctly installed:
dotnet tool list
and you will get a list of repo-local tools:
Package Id      Version              Commands      Manifest
-------------------------------------------------------------------------------------------------------
bdna            0.2.263              bdna          projects\scratch\tools\.config\dotnet-tools.json
Check that it's up and running:
dotnet bdna
and you should be greeted with a banner, like:
The installation is done!
You have successfully installed BDNA into your directory, and exactly the same steps will apply in a cloned git repository.
Checking benchmarks
What remains now is to get some benchmarks. If you've followed this series, you'll have some demonstration projects that generate benchmarks, such as
NewDayTechnology
/
benchmarking-performance-part-2
A simple demonstration of BenchmarkDotNet
Get some benchmarks
Clone the repo and start building:
dotnet clean
dotnet restore
dotnet build -c Release

cd src\benchmarkdotnetdemo\bin\Release\net7.0
dotnet Benchmarkdotnetdemo.dll -f *
The results will be found under **\BenchmarkDotNet.Artifacts\results.
Collect the data from your recent BenchmarkDotNet run
BDNA works by aggregating sequential benchmark runs. To aggregate (from the repo's root directory):
dotnet bdna aggregate -new ".\src\benchmarkdotnetdemo\bin\Release\net7.0\BenchmarkDotNet.Artifacts\results" -aggs ".\bdna" -out ".\bdna" -runs 30
To see all options try
dotnet bdna aggregate -?
Repeatedly run benchmarks (dotnet Benchmarkdotnetdemo.dll -f *) and aggregate (dotnet bdna aggregate ...) to build a dataset.
When benchmarking you'll need points of reference for each datapoint. You can use
--build %build_number%when aggregating each benchmark run to annotate with the build number. Tags are also supported.
Analyse the data
Now, we want to check the dataset for deviances. To see some errors we'll assume very strict deviance (0%) and allow no errors:
dotnet bdna analyse --aggregates ".\bdna" --tolerance 0 --maxerrors 0 --verbose
dotnet bdna analyse will send results to the console. If all is well you'll see a nice confirmatory message:
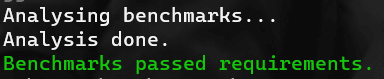
But if there are degraded benchmarks they'll be listed:

If too many errors are found the tool's return code will be 1: your CI script will need to watch for this return code and fail the build accordingly.
Reporting on the data
Console logs are often fine for CI pipelines. Wouldn't it be good to get some graphs of performance over time?
dotnet bdna report --aggregates ".\bdna" --verbose -r csv -r json -f * -out ".\bdna_reports"
For help see
dotnet bdna report --help
BDNA will build a CSV (and/or JSON) file containing selected benchmarks. Each benchmark is exported with namespace, class, method, parameters and annotations (build number, tags, etc).
Import the report file in your favourite BI tool and:
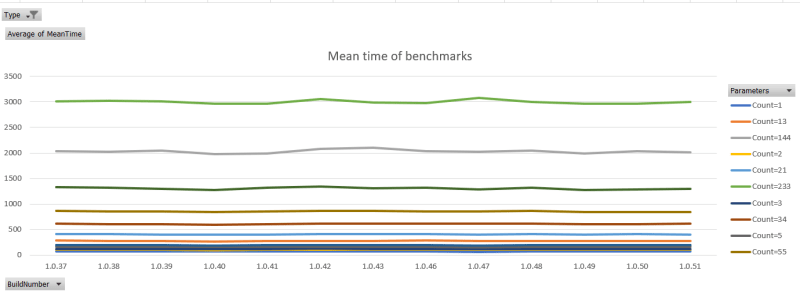
These measurements were taken from a machine with a lot of background procesing going on, and so you see peaks and troughs in the measurements. The general trend is flat. This is good, as the code didn't change between builds.
What have we learned?
We've discussed a very simple method of determining degraded performance where we compare results against a best-known result.
We've described how to set up local dotnet tools and nuget configurations.
We've introduced a tool that can collect, report & detect performance degradations, and how it can be used in a sandbox environment.

Top comments (0)