Hello, Joel here! I'm working with Netdata to help more people deploy real-time system and application monitoring. I hope this Ansible guide helps a few of you build some extraordinary infrastructure.
Netdata's one-line kickstart is zero-configuration, highly adaptable, and compatible with tons of different operating systems and Linux distributions. You can use it on bare metal, VMs, containers, and everything in-between.
But what if you're trying to bootstrap an infrastructure monitoring solution as quickly as possible. What if you need to deploy Netdata across an entire infrastructure with many nodes? What if you want to make this deployment reliable, repeatable, and idempotent? What if you want to write and deploy your infrastructure or cloud monitoring system like code?
Enter Ansible, a popular system provisioning, configuration management, and infrastructure as code (IaC) tool. Ansible uses playbooks to glue many standardized operations together with a simple syntax, then run those operations over standard and secure SSH connections. There's no agent to install on the remote system, so all you have to worry about is your application and your monitoring software.
Ansible has some competition from the likes of Puppet or Chef, but the most valuable feature about Ansible is that every is idempotent. From the Ansible glossary:
An operation is idempotent if the result of performing it once is exactly the same as the result of performing it repeatedly without any intervening actions.
Idempotency means you can run an Ansible playbook against your nodes any number of times without affecting how they operate. When you deploy Netdata with Ansible, you're also deploying monitoring as code.
In this guide, we'll walk through the process of using an Ansible playbook to automatically deploy the Netdata Agent to any number of distributed nodes, manage the configuration of each node, and claim them to your Netdata Cloud account. You'll go from some unmonitored nodes to a infrastructure monitoring solution in a matter of minutes.
Prerequisites
- A Netdata Cloud account. Sign in and create one if you don't have one already.
- An administration system with Ansible installed.
- One or more nodes that your administration system can access via SSH public keys (preferably password-less).
Download and configure the playbook
First, download the playbook, move it to the current directory, and remove the rest of the cloned repository, as it's not required for using the Ansible playbook.
git clone https://github.com/netdata/community.git
mv community/netdata-agent-deployment/ansible-quickstart .
rm -rf community
Next, cd into the Ansible directory.
cd ansible-quickstart
Edit the hosts file
The hosts file contains a list of IP addresses or hostnames that Ansible will try to run the playbook against. The hosts file that comes with the repository contains two example IP addresses, which you should replace according to the IP address/hostname of your nodes.
203.0.113.0  hostname=node-01
203.0.113.1  hostname=node-02
You can also set the hostname variable, which appears both on the local Agent dashboard and Netdata Cloud, or you can omit the hostname= string entirely to use the system's default hostname.
Set the login user (optional)
If you SSH into your nodes as a user other than root, you need to configure hosts according to those user names. Use the ansible_user variable to set the login user. For example:
203.0.113.0 hostname=ansible-01 ansible_user=example
Set your SSH key (optional)
If you use an SSH key other than ~/.ssh/id_rsa for logging into your nodes, you can set that on a per-node basis in the hosts file with the ansible_ssh_private_key_file variable. For example, to log into a Lightsail instance using two different SSH keys supplied by AWS.
203.0.113.0  hostname=ansible-01  ansible_ssh_private_key_file=~/.ssh/LightsailDefaultKey-us-west-2.pem
203.0.113.1  hostname=ansible-02  ansible_ssh_private_key_file=~/.ssh/LightsailDefaultKey-us-east-1.pem
Edit the vars/main.yml file
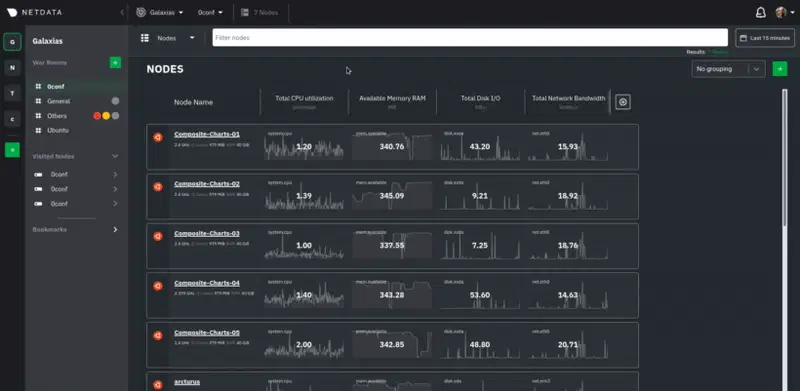
In order to claim your node(s) to your Space in Netdata Cloud, and see all their metrics in real-time in composite charts or perform Metric Correlations, you need to set the claim_token and claim_room variables.
To find your claim_token and claim_room, go to Netdata Cloud, then click on your Space's name in the top navigation, then click on Manage your Space. Click on the Nodes tab in the panel that appears, which displays a script with token and room strings.
Copy those strings into the claim_token and claim_rooms variables.
claim_token: XXXXX
claim_rooms: XXXXX
Change the dbengine_multihost_disk_space if you want to change the metrics retention policy by allocating more or less disk space for storing metrics. The default is 2048 Mib, or 2 GiB.
Because we're claiming this node to Netdata Cloud, and will view its dashboards there instead of via the IP address or hostname of the node, the playbook disables that local dashboard by setting web_mode to none. This gives a small security boost by not allowing any unwanted access to the local dashboard.
You can read more about this decision, or other ways you might lock down the local dashboard, in our node security doc.
Curious about why Netdata's dashboard is open by default? Read our blog post on that zero-configuration design decision.
Run the playbook
Time to run the playbook from your administration system:
ansible-playbook -i hosts tasks/main.yml
Ansible first connects to your node(s) via SSH, then collects facts about the system. This playbook doesn't use these facts, but you could expand it to provision specific types of systems based on the makeup of your infrastructure.
Next, Ansible makes changes to each node according to the tasks defined in the playbook, and returns whether each task results in a changed, failure, or was skipped entirely.
The task to install Netdata will take a few minutes per node, so be patient! Once the playbook reaches the claiming task, your nodes start populating your Space in Netdata Cloud.
What's next?
Go use Netdata!
If you need a bit more guidance for how you can use Netdata for health monitoring and performance troubleshooting, see our documentation. It's designed like a comprehensive guide, based on what you might want to do with Netdata, so use those categories to dive in.
Some of the best places to start:
- Enable or configure a collector
- Supported collectors list
- See an overview of your infrastructure
- [Interact with dashboards and charts](https://learn.netdata.cloud/docs/visualize/interact-dashboards-charts
- Change how long Netdata stores metrics
We're looking for more deployment and configuration management strategies, whether via Ansible or other provisioning/infrastructure as code software, such as Chef or Puppet, in Netdata's community repo. Anyone is able to fork the repo and submit a PR, either to improve this playbook, extend it, or create an entirely new experience for deploying Netdata across entire infrastructure.

Top comments (0)