
Quite recently, I reached a milestone of 10k post views in Dev. Which might seem less to you but a lot to me. You know, it feels good to see people reading your posts(and giving some unicorns 🦄). And I thought it would be a good idea to have a better visualization of the data that dev.to provides. So I did. I think it will be helpful if not, kinda cool for those who write quite regularly at Dev.
It would be a good idea not to show the code here but the results as you can always see the code from this Github repo.
 Muhimen123
/
DevDashboard
Muhimen123
/
DevDashboard
A command line dashboard for dev.to with some extra functionality such as data analysis
(Check for the installation guide in the readme section)
Data source
At first, I thought of web scraping to collect the data. But then I emailed the good peoples of Dev about it and they told me about the Dev API which I was unaware of back then. So, all the data is received from the Dev API. And if you want to use the program, you will need an API key.
Installation
The installation process is nothing fancy. And it will be more smooth if you already have python & pip installed in your machine. You can follow the installation steps mentioned in the Github repo.
But if you try to run the script, you will get errors. Because it will require you to add an API key. To get an API key read this. You shouldn't be facing any difficulty with this.
Once you have an API key, open dev_api.py in any text editor you want. You will see a part just like this.
headers = {
    "api-key": apikey # type your API key here
}
Simply put your API key where mentioned(with quotations) and you are good to go.
Running for the first time
Just go to the file path where you have cloned it. Then via terminal enter this command.
python main.py
IMPORTANT NOTE
Before you run any command related to date visualization, type this command.
==> writedata
What it will do is write some data in a .csv file and store it in the current folder where you are. It is important to do as other scrips will require this data to draw graphs, charts. And it's often a good idea to update the data file for getting accurate data visualizations.
Some basic commands
Before we get into the fancy data visualization part, let's take a small look at the few available commands.
| Commands | Results |
|---|---|
| show-data | Shows you a bit detail about your published posts |
| list-all | Same as 'show-data' but a bit compact and less detailed |
| show-data-single | Same as 'show-data' but for a single post |
| writedata | Writes all the data in a .csv file and saves in the working directory |
| help | Give you the list of available commands |
| exit | Exit the programme |
And the commands are case insensitive.
Now the fun part
1.Few bar charts
The very first you command you should try running is graph-bar. It will show you a bar graph for all your existing posts. And it will include post view, post reactions, and post comments as shown in the picture below.

But as you can see, this graph isn't that visually appealing as the bar for post views are way too longer than the bars for post views and reactions.
Luckily, I have a solution for that. Say that you want to see only a bar graph that will compare your post reactions and comments. then you can do this.
==> graph-bar-reactions-comments //Order doesn't matter.
You will get an output like this.

you can also try the following commands
- graph-bar-views
- graph-bar-reactions
- graph-bar-comments-views
- graph-bar-views-comments-views (same as graph-bar)
As you guessed, you can permute them as you wish. Also, the order doesn't matter.
However, you are not only restricted to see bar charts for views, reactions, and comments. You can see bar charts for used tags also. Just like this
==> graph-bar-tags
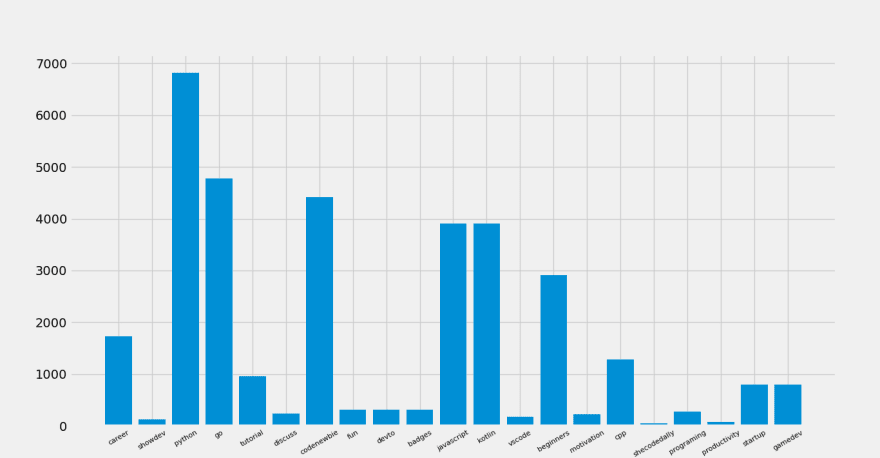
Little explanation: Suppose you wrote two posts. The first one used the tags [python, javascript] and got 500 views and the second one only used the tag [python] and got 700 views. So, for python tags, you got a total of 1200 views and for javascript tag, you got a total of 500 views. And this is what the plot is showing.
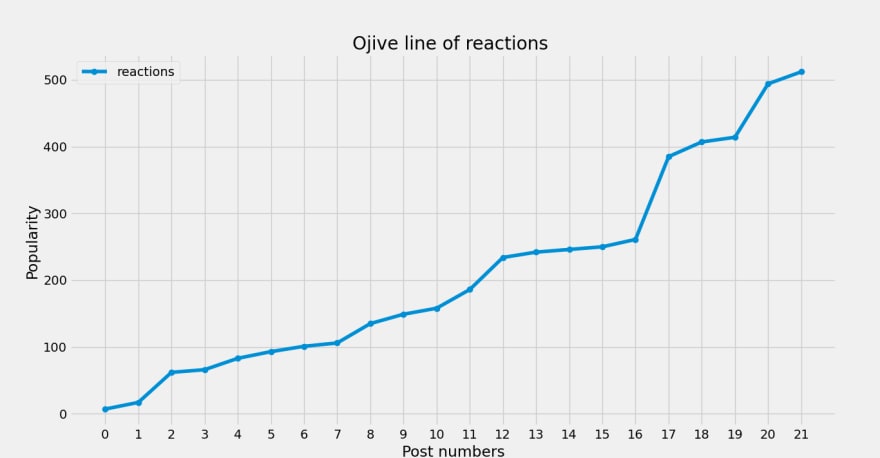
2. Some line charts
Ever seen a stock market line charts? Aren't they cool? So, I decided to implement the same feature here as well. And here is the outcome.

And the command for this graph is
==> graph-progress
Just like graph-bar you can suffix the command like this
==> graph-progress-reactions
As always, the order of the suffixes doesn't matter. And you can suffix the command with this
- views
- comments
- reactions
3. Pie charts
Last but not the least, here is a pie chart(or maybe a doughnut?).

This pie chart indicated the number of times you used the tag. And the exploded part is the tag you used the most.
What's next
Short answer, I don't know. At this moment I have no future plan for this project (Because I have a brilliant plan for the next post).
Wanna contribute
The code is open source. Take a deep look(and don't get lost because the code isn't that much good 😑). Maybe you can find some flaws or maybe optimize the code. Or, most probably, add some more cool features. It's open for pull requests. (You can also write better documentation as the current one SUCKS 😶)
Conclusion
So, you liked the project that I did? Let me know in the comment section. Maybe add some suggestions for some better features or if you run into any trouble.
Till the next time, happy coding for you. 😀

Top comments (6)
Nice project. I've been making a a wrapper in R for the dev api too :)
Yeah, that is a cool one.
This is pretty neat and good! Good luck to this project!
Thank you
Hey amazing one, if you create issues in github that would be nice as it will help in contributing 🙌
Thanks, I will see what I can do. 😉