
Coverimage by Serge Bystro on Flickr
You have an API program that developers are adopting, but unsure how much. How long does it take for a new integration to move to revenue-generating? If you came from a web or mobile product management background, you may already be familiar with mobile product analytics to measure app engagement and retention. Growing APIs have similar KPIs to measure the success of your API program. This article will talk more about what you should be measuring and how to leverage that information.
The developer funnel
While traditional customer funnels will consist of just a marketing and sales funnel component. However, APIs as a product where customers and partners include developers have what is called the developer funnel or
integration funnel. The developer funnel is after the marketing funnel and before the sales funnel and has three core stages:

Pre-integration stage
Developers enter the pre-integration stage after marketing funnel. While there is a blur for what is considered marketing vs developer funnel, the intent is the main factor. Are they just considering a solution through well-defined marketing assets like case studies, content, and demo accounts or committed to testing the solution themselves.
Once the evaluation or consideration phase is positive, there is intent to test. This causes the developer to start the installation which can be seen by creating a blank workspace, downloading a configuration file, or copying an API key.
This implies your product is freemium, has a free trial, or other.
Sandbox stage
A potential customer enters the sandbox stage as soon as a single action is taken on your API that gives the developer a warm feeling that
they accomplished something and able to verify this is a viable solution for them. The time to go from pre-integration stage to sandbox stage is usually measured as Time to First Hello World (TTFHW). This is a critical KPI that every API product manager should track and reduce as much as possible.
Developers may not move into the sandbox stage for many reasons including:
Integration issues such as errors and bugs in SDKs or implementation
For example, if the developer received 500 errors from your API or the SDK didn't make any calls to your API. The later is one of the hardest to measure since the developer completed the implementation but no actions were captured on your side.No easy way to verify that the implementation is correct. If your product looks empty even after integration, a developer may assume it doesn't work. This can happen for security and analytics companies where there are no meaningful insights until a large amount of data is processed.
An action was taken on API but unclear what the value is. The action should have a clear value and not just a message saying "You're integrated." For a communications API, that value may be sending a single SMS. For an analytics company, it may be capturing and displaying a single event.
A developer entered the sandbox stage when the integration is successful and there is a clear sign of value-creating your aha moment. These developers start to become an internal advocate for your solution.
Production stage
Once a developer sees value in a solution, the developer wants to push their implementation to production as soon as possible. However, the developer may not be able to push your API to production due to internal blockers, many outside the control of the individual developer.
Developers may not move into the production stage for many reasons including:
Project priorities.
Customer bugs or other project features may take priority. Your communications API integration took a back seat just because the developer had a pile of Jira tickets assigned to him or her.Legal and compliance.
Especially in regulated industries such as financial and health, the developer may have to wait until necessary approvals from legal.Functional and performance testing.
The company may have internal policies for testing third-party services which need to be finished first.
Your goal is to empower the developer with the necessary assets and tools to eliminate these objections.
Once a developer moves into the production stage, there is a measurable amount of traffic going to your API from that account.
The time it takes to get to production level traffic can be called Time To First Working App (TTFWA) or
Time To First Paid App (TTFPA).
Creating funnel goals
In order to have an accurate snapshot of your API business, each funnel boundary requires well-defined goals.
Let's use Algolia, a search API, as an example.
Pre-integration step goals
The first step for Algolia will be when a developer uses the API key copy feature. At this point, the developer already signed up and going through the onboarding flow.
Sandbox step goals
Algolia has two core features around its API. A query or search API and an indexed API. Algolia's success metric would be developers who
were able to index at least one entity via the index API. If the developer called the query API when no data has been stored in Algolia, that
is not considered a success as the query will be empty.
In order to keep their integration simple, they can either:
- 1. Drive users to index a new entity via
POST /1/indexes/endpoint - 2. Use sample data to bootstrap a sample index that the developer can query
Let's say we go with (1), then our funnel conversion point would be any developers who performed at least one POST /v1/indexes operation.
Algolia may want a tighter conversion metric so they may track any developer who performed at least one POST /v1/indexes operation AND one POST /1/indexes/{indexName}/query operation WHERE response Content-Length > 0. This means the developer successfully indexed at least a single entity and was able to read it back.
Production step goals
Creating a metric for what is considered production-level traffic can be hard as it could be industry or project dependent. For Algolia, an e-commerce app has different levels of production use than an internal enterprise app with lots of dynamic content. For the enterprise app with dynamic content, each entity could be reindexed tens or hundreds of times a day programmatically with updated data. However, if the data is never queried, then the value of Algolia hasn't been seen yet. So just looking for developers with more than 1,000
POST /1/indexes/ operations may not be the best value metric to track. A better value metric might be developers who have more than 1,000
POST /1/indexes/{indexName}/query operations WHERE response Content-Length > 0.
Note how we are focusing on the core value of Algolia which is search. We are less focused on auxiliary features like Algolia's monitoring API,
reporting API, etc, nor do we look at advanced features like synonyms or rules APIs.
Developer cohort segmentation
Now that we have an understanding of conversion rates for each stage of the developer funnel, it's important to leverage API Analytics to understand how different cohorts of developers move through your developer funnel. Without it, you can have a false sense of success.
For example, you can have a high conversion rate from Pre-integration to Production stage, yet if the majority of developers are side projects
without buying power, then you may need to reevaluate your targeting.
Building Profiles of Users and Companies
In order to segment your funnel further, your API analytics solution should have a way to create User Profiles and Company Profiles.
Recommended variables to track in user profiles include:
- Name
- Job Title
- Referring site
Recommended variables to track in companies include:
- Company Revenue
- Number of Employees
- Industry
- Alexa Rank
- Plan MRR
Once you have this information, your developer funnel analytics become far more valuable. Instead of just tracking the high-level integration journey,
you're able to see who is integrating and who isn't. For example, we can segment by Company Revenue to compare the conversion rate of
users working on side projects vs. the conversion rate of engineers at Fortune 500 companies.
Tracking companies (i.e. accounts) separately from users ensures you're able to create metrics on a number of developers or teams at an organization using your solution.

Understanding API Design
Just like building profiles of users and companies, your API Analytics solution should understand the business functionality of your API.
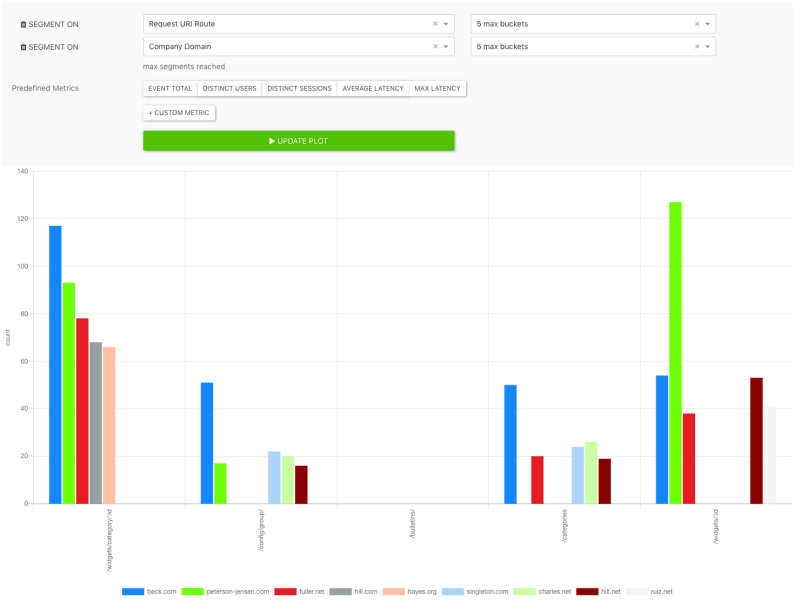
If your API is rest, then tracking just POST /items/1 and POST /items/2 would not be valuable. However, adding metadata associated with the API
transaction can give you higher level trends on usage patterns. For example, if your API is RESTful, your analytics solution should
bucket the API transactions into a specific REST resource operation like POST /items/:id. This enables higher-level charts such as below which
shows the top companies using each REST API operation.
Defining API engagement
Before we dig into critical business metrics like acquisition channel performance and API growth, we need to define what is considered engagement with an API. After all, a developer just hitting your root endpoint or just probing for API health may not be considered real engagement. Continuing with the Algolia example, Algolia's core business value prob is fast search. Thus, their criteria to define engagement on an API is an account performing at least one search POST /1/indexes/{indexName}/query in the last 28-days.
Measuring Developer Acquisition
Efficient new customer acquisition can make or break an API business. It's imperative to consider the conversion rates of our three steps defined in our developer funnel when measuring the effectiveness of online marketing campaigns across traffic sources. API product marketing leaders should move beyond basic metrics like sign-ups and consider the developer integration funnel. This enables you to understand how far those sign-ups went through the integration steps.
For example, a channel like Facebook ads may give your B2B solution a large reach, but if a very small fraction of those sign-ups end up going through the integration process due to poor targeting, your overall effectiveness of the channel is lowered as it's unlikely for you to extract much value from someone who just signed up without doing anything else.
How to properly measure developer marketing channels
If we sync marketing data such as from the Urchin Tracking Module (UTM) parameters from marketing automation and analytics tools like Hubspot or Amplitude, then we can leverage this in our cohort analysis. This enables us to take our earlier developer funnel and segment by the channel.
Once we do that, we're able to see the conversion rate for each step broken down by campaign.
What is Moesif? Moesif is the most advanced API analytics platform used by over 2000 organizations to understand what your most loyal customers are doing with your APIs, how they're accessing them, and from where.
Measuring API growth and engagement
API MAU and API DAU
If you want to track the growth of your API program, API Monthly Active Users (API MAU) and API Daily Active Users (API DAU) are
two KPIs every data-driven product leader should be tracking.
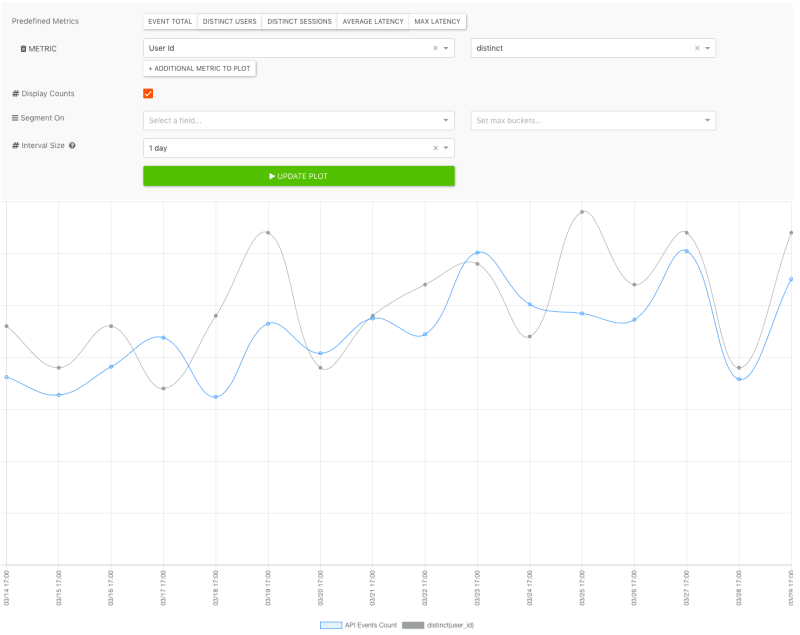
This is similar to web and mobile MAU and can give a high-level overview of the growth and health. However, instead of tracking distinct users performing UI interactions such as button clicks within your app, API MAU is tracking distinct users performing programmatic interactions with your API. Depending on your industry, a distinct user can be an individual user or developer or it can be distinct companies or accounts. API Analytics products like Moesif can track which is critical for account-level analytics.
Why 28-days?
Even though we say MAU, we should really be measuring activity in fixed 28-day windows, not the entire month. By using 28-days, we are able to ignore bias due to the number of days in a month not being consistent. In addition, 28-days ensures each time window starts on the same weekday. This guarantees we always have the same number of weekdays and weekends in each time window. Many companies, especially B2B, have different levels of usage on the weekends compared to weekdays. By keeping these numbers consistent, we can remove those biases.
28-day API usage/28-day-active companies
You should also be tracking total API usage per active company for the same engagement definition. API usage is simply the total API usage in sub of API calls rather than counting distinct users. By dividing API usage by active companies, you can track how each account is growing with your API over time. This metric is a leading indicator of revenue expansion. If API Usage/Active companies are flat (or worse decreasing), your API is not growing with the accounts and may be hard to drive upsells through plan limits. Whereas an API program with a rapidly growing API usage/active companies will enjoy a growing average contract value and top-line revenue. Of course, this assumes your pricing is based on some usage metric such as search operations or index operations in Algolia's case.
Distinct API operations/application
If you have an API with hundreds of separate features and entities like GitHub or Intuit's APIs, then measuring how many separate functions each app calls can help you understand the breadth of API usage. It's helpful to plot this as a histogram to find the percentage of power users who are using your API fully compared to other developers who may be using only one or two endpoints. How you track distinct API operations will depend on the architecture of your API. For example, if your API is REST, you may have
REST endpoints like:
GET /items
GET /items/:id
POST /items

GET /users
GET /users/:id
POST /users

GET /purchases
GET /purchases/:id
POST /purchases

...
whereas, if you're API is GraphQL, you may want to track query and mutate operations like:
getItems
createItem
createItem

getUsers
getUser
createUser

getPurchases
getPurchase
createPurchase
Conclusion
There are many deeper API metrics that you should be tracking if you intend to build a growing API program. However, if you haven't started taking a data-driven approach yet, these metrics are a good starting point.
As you grow your API program, you'll be tracking other KPIs that can show you the health of your API program.
Tools like Moesif API Analytics can help you get started measuring these metrics with just a quick SDK installation.
This article was written by Moesif founder and CEO Derric Gilling for the Moesif blog.


Top comments (0)