
There are a lot of engineers who have never been involved in statistics or data science. So, to build data science pipelines or rewrite produced by data scientists code to an adequate, easily maintained code many nuances and misunderstandings arise from the engineering side. For these Data/ML engineers and novice data scientists, I make this series of articles. I'll try to explain some basic approaches in plain English and, based on them, explain some of the Data Science model concepts.
The whole series:
- Data Science. Probability
- Data Science. Bayes theorem
- Data Science. Probability distributions
- Data Science. Measures
- Data Science. Correlation
- Data Science. The Central Limit Theorem and sampling
- Demystifying hypothesis testing
The practice of studying random phenomena shows that although the results of individual observations, even those carried out under the same conditions, can differ. But the average results for a sufficiently large number of observations are stable and only weakly fluctuates by the results of individual observations. The theoretical basis for this remarkable property of random phenomena is the Central Limit Theorem(aka law of large numbers).
According to the central limit theorem, the average value of the data sample will be closer to the average value of the whole population and will be approximately normal, as the sample size increases. Importance of this theorem comes from the fact that this is true regardless of the distribution of a population.
To illustrate the concept check the following animation of the die roll and code:

import numpy as np
import seaborn as sns
import matplotlib.pyplot as plot
import matplotlib.animation as animation
from wand.image import Image
from wand.display import display

# 1000 simulations of die roll
n, m = 200, 31

# In each simulation, there is one trial more than the previous simulation
avg = []
for i in range(2, n):
    a = np.random.randint(0, m, i)
    avg.append(np.average(a))


# Function that will plot the histogram, where current is the latest figure
def clt(current):
    # if animation is at the last frame, stop it
    plt.cla()
    if current == n:
        a.event_source.stop()

    plt.xlim(0, m)
    plt.hist(avg[0:current])

    plt.gca().set_title('Expected value of die rolls')
    plt.gca().set_xlabel('Average from die roll')
    plt.gca().set_ylabel('Frequency')

    plt.annotate('Die roll = {}'.format(current), [3, 27])

fig = plt.figure()
a = animation.FuncAnimation(fig, clt, interval=1, save_count=n)
a.save('animation.gif', writer='imagemagick', fps=10)
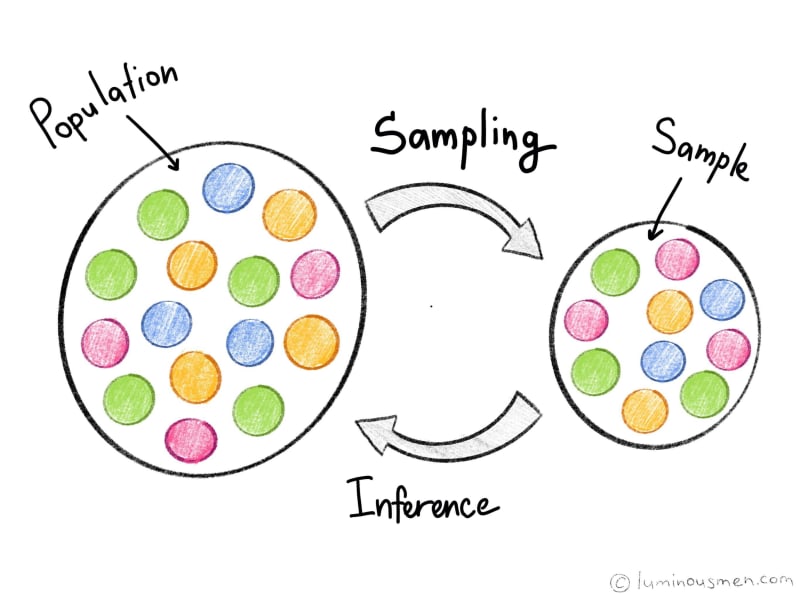
In a practical world, to understand the characteristics of a population, scientists usually sample data and work with sample' statistics. They deal with samples to understand and to generalize insights about the population. Using a big sample size, central limit theorem allows us to apply properties of normal distribution in this process.
We already know that the normal distribution is special. We can also use some of its properties for distributions that, strictly speaking, cannot be called normal.
Sampling
Before that, we talked about how, knowing the theoretical distribution, knowing the theory of probability, knowing the parameters of the distribution, to evaluate the sample what happens to the general population. But there is a problem that even the best theory and even the most knowing distribution will not help us if the sample on which we estimate is designed incorrectly or it does not represent the population.
Why sampling?
Well, the logical question is: if we take a sample, we, in any case, discard some data. Why do not take all the data and work with all the elements of the population?
First, the data need to be collected, and it is very expensive. Think about surveys. Even if we are not talking about the population of all Americans, but we want to present, for example, all the residents of California, it is 39 million people. To take an interview with 39 million people, we need budgets, which, of course, we don’t have. Besides, even if we have such budgets, it is almost impossible to reach all residents of any state.
And the idea of sampling is, in general, simply — take a small set, but which will be quite heterogeneous, in terms of some key criteria that represent our general population. That is, not to interview all of California residents, but to take some kind of a slice that will represent California by important criteria for us.
The idea of sampling is very similar to the idea of soup. When we cooked a soup that contains a lot of ingredients, they are cut differently, they are added at different times, and we need to evaluate the quality of the soup. We do not need to eat all the soup to evaluate how tasty it turned out. Moreover, if we needed to eat all the soup to understand how good it is, then any idea of collective cooking would be somewhat absurd. But what are we doing? We boil the soup, and after that, we take a spoon, scoop up and, based on this small portion, we are trying to assess whether we have done the soup or we need to change something in it. If we just take some random part, for example, scoop up from above, then we will have a spoon full of water, and it will not give us any idea about the ingredients (vegetables or meat). If we scoop anyhow from the bottom, it may turn out that we only got large pieces, but we did not understand anything about small pieces. In order to get all the ingredients of our soup into sample on which we can get the taste of the soup, we need to mix it first, and then, after we mix it well, scoop it up, and we see that then all the ingredients turn out to be in the spoon — large, small, and water, all. That is, we can estimate already at this portion how well all the ingredients in the soup are prepared. The same with sampling.
The analog of this mixing in the case of sampling is random sampling. It is a random selection, the essence of which is to ensure an equal probability for each element of the population in the sample to get, it provides us with this representativeness of the sample.
What's terrible is that the sample is not representative?
Well, I will highlight a few problems. The simplest and most understandable example — if we select, for example, an available sample.

That is, we study the preferences of young people, but since we study or work in a certain university, we only interview students of our university and say that we will know about all the young people based on this study. Obviously, we will not know about all the young people, because the sample is a very specific group. The available sample gives us some part of the picture, but not a complete one. In this case, a substantial part of young people who do not study at universities or study at other universities will not be covered by our sample. Another problem is — we can select only those people who want to talk to us. That is, the trouble with such non-representative samples is that we do not give equal opportunities to different people, different points of view to be represented in our sample. A random sample at least formally guarantees a possibility of such a representation.
Probability sampling methods

The simplest and most understandable method is a simple random sample when we have a complete list of elements of the general population. For example, our population is all owners of the telephone numbers of NYC, and we have a complete list of these numbers. We turn on the "random number sensor", select the number of objects we need and call these phone numbers — a simple random selection.

Another option is stratified sampling. Here we are no longer doing a random selection, but here we know something about our population. We know that it consists of several homogeneous clusters, which need to be presented in our sample. For example, a man and a woman, who have different opinions on some questions. And we first divide our population into men and women clusters, and then we randomly select in both clusters to guarantee the representation of these clusters in the final sample.

And one more variant of the random sample is the cluster sampling. Such samples are used when we explore cities, for example, which are very often divided into districts. Some of the regions are similar to each other, some are different, and we have such kind of clusters of areas that are similar, say, by socio-economic conditions. And we first divide the city into clusters and then randomly select one of these clusters one at a time so as not to go to all twelve districts, for example, but choose three out of twelve, randomly, dividing them into these similar categories first, and then work inside these areas.
Non-probability sampling methods

Non-probability sampling methods are also needed. Moreover, in some cases, non-probability sampling is irreplaceable. For example, there is a sampling method — snowball sampling. It is necessary if we investigate hard-to-reach groups, or we don’t know exactly the volume of the general population then it turns out that we are talking to the first person, he contact us with the next one, the next, the next, and we sort of accumulate a snowball. We increased the sample, starting from one, or sometimes start several such snowballs to guarantee the heterogeneity of the population. But of course this sample is statistically unrepresentative, but there are tasks that we simply cannot do without it.
Conclusion
The central limit theorem is quite an important concept in statistics, and consequently data science. This theorem will allow us to test the so-called statistical hypotheses, i.e. allow testing assumptions on applicability to the whole population. We will be covering the concept in the later posts.
Sampling is a cheap and understandable concept of getting little but representative data from the population. The probability methods are preferable for most of the research problems, but there are tasks for which only non-random samples can help. There are tasks for which they are irreplaceable, but in the statistical sense non-random samples are not representative. Therefore, all of this theoretical knowledge about distributions, about concluding the general population based on a sample, we can do this only on random samples.
Thank you for reading!
Any questions? Leave your comment below to start fantastic discussions!
Check out my blog or come to say hi 👋 on Twitter or subscribe to my telegram channel.
Plan your best!

Top comments (0)