
Debugging is twice as hard as writing the code in the first place. Therefore, if you write the code as cleverly as possible, you are, by definition, not smart enough to debug it. — Brian W. Kernighan
There are 2 hard problems in computer science: cache invalidation, naming things, and off-by-1 errors. — Leon Bambrick
Debuggers don't remove bugs. They only show them in slow motion. — Unknown
Above quotes chosen from this collection at softwareengineering.stackexchange.
General tips
Knowing how to debug your programs is crucial and should be ideally taught right from the start instead of a chapter at the end of a beginner's learning resource. Think Python is an awesome example for such a resource material.
Debugging is often a frustrating experience. Taking a break helps. It is common to find or solve issues in your dreams too (I've had my share of these, especially during college and intense work days).
If you are stuck with a problem, reduce the code as much as possible so that you are left with minimal code necessary to reproduce the issue. Talking about the problem to a friend/colleague/inanimate-objects/etc can help too — famously termed as Rubber duck debugging. I have often found the issue while formulating a question to be asked on forums like stackoverflow/reddit because writing down your problem is another way to bring clarity than just having a vague idea in your mind.
Here's some awesome articles on this challenging topic:
- What does debugging a program look like?
- How to debug small programs
- Debugging guide
- Problem solving skills
Here's an interesting snippet (modified to keep it small) from a collection of interesting bug stories.
A jpeg parser choked whenever the CEO came into the room, because he always had a shirt with a square pattern on it, which triggered some special case of contrast and block boundary algorithms.
See also curated list of absurd software bug stories.
Common beginner mistakes
The previous chapter already covered syntax errors. This section will discuss more Python gotchas.
Python allows you to redefine built-in functions, modules, classes etc (see stackoverflow: metaprogramming). Unless that's your intention, do not use keywords, built-in functions and modules as your variable name, function name, program filename, etc. Here's an example:
# normal behavior
>>> str(2)
'2'

# unintentional use of 'str' as variable name
>>> str = input("what is your name? ")
what is your name? learnbyexample
# 'str' is no longer usable as built-in function
>>> str(2)
Traceback (most recent call last):
  File "<stdin>", line 1, in <module>
TypeError: 'str' object is not callable
Here's another example:
>>> len = 5
>>> len('hi')
Traceback (most recent call last):
  File "<stdin>", line 1, in <module>
TypeError: 'int' object is not callable
As an exercise, create an empty file named as
math.py. In the same directory, create another program file that imports themathmodule and then uses some feature, sayprint(math.pi). What happens if you execute this program?
See also:
- Think Python: Debugging chapter
- inventwithpython: common runtime errors and common python gotchas
- pythonforbiologists: common beginner errors
- stackoverflow: common pitfalls in Python
pdb
Python comes with a handy built-in library pdb that you can use from the CLI to debug small programs. See docs.python: pdb for documentation. Here's some of the frequently used commands (only short form is shown, see documentation for long form and more details).
-
lprints code around the current statement the debugger is at, useful to visualize the progress of debug effort -
llprints entire code for the current function or frame -
sexecute current line, steps inside function calls -
nexecute current line, treats function as a single execution step -
ccontinue execution until the next breakpoint -
p expressionprint value of an expression in the current context, usually used to see the current value of a variable -
hlist of available commands-
h chelp onccommand
-
-
qquit the debugger
Here's an example invocation of the debugger for the num_funcs.py program seen earlier in the Importing your own module section. Only the n command is used below. The line with > prefix tells you about the program file being debugged, current line number and function name. The line with -> prefix is the code present at the current line. (Pdb) is the prompt for this interactive session. You can also see the output of print() function for the last n command in the illustration below.
$ python3.9 -m pdb num_funcs.py
> /home/learnbyexample/Python/programs/num_funcs.py(1)<module>()
-> def sqr(n):
(Pdb) n
> /home/learnbyexample/Python/programs/num_funcs.py(4)<module>()
-> def fact(n):
(Pdb) n
> /home/learnbyexample/Python/programs/num_funcs.py(10)<module>()
-> num = 5
(Pdb) n
> /home/learnbyexample/Python/programs/num_funcs.py(11)<module>()
-> print(f'square of {num} is {sqr(num)}')
(Pdb) n
square of 5 is 25
> /home/learnbyexample/Python/programs/num_funcs.py(12)<module>()
-> print(f'factorial of {num} is {fact(num)}')
Continuation of the above debugging session is shown below, this time with s command to step into the function. Use r while you are still inside the function to skip until the function encounters a return statement. Examples for p and ll commands are also shown below.
(Pdb) s
--Call--
> /home/learnbyexample/Python/programs/num_funcs.py(4)fact()
-> def fact(n):
(Pdb) ll
  4  -> def fact(n):
  5         total = 1
  6         for i in range(2, n+1):
  7             total *= i
  8         return total
(Pdb) n
> /home/learnbyexample/Python/programs/num_funcs.py(5)fact()
-> total = 1
(Pdb) p n
5
(Pdb) r
--Return--
> /home/learnbyexample/Python/programs/num_funcs.py(8)fact()->120
-> return total
(Pdb) n
factorial of 5 is 120
--Return--
> /home/learnbyexample/Python/programs/num_funcs.py(12)<module>()->None
-> print(f'factorial of {num} is {fact(num)}')
If you continue beyond the last instruction, you can restart from the beginning if you wish. Use q to end the session.
(Pdb) n
--Return--
> <string>(1)<module>()->None
(Pdb) n
The program finished and will be restarted
> /home/learnbyexample/Python/programs/num_funcs.py(1)<module>()
-> def sqr(n):
(Pdb) q
You can call breakpoint() or pdb.set_trace() to set breakpoints in the code and use it in combination with
ccommand.
See also:
IDLE debugging
Sites like Pythontutor allow you to visually debug a program — you can execute a program step by step and see the current value of variables. Similar feature is typically provided by IDEs. Under the hood, these visualizations would likely be using the pdb module discussed in the previous section.
This section will show an example with IDLE. Before you can run the program, first select Debugger option under Debug menu. You can also use idle3.9 -d to launch IDLE in debug mode directly. You'll see a new window pop up as shown below:
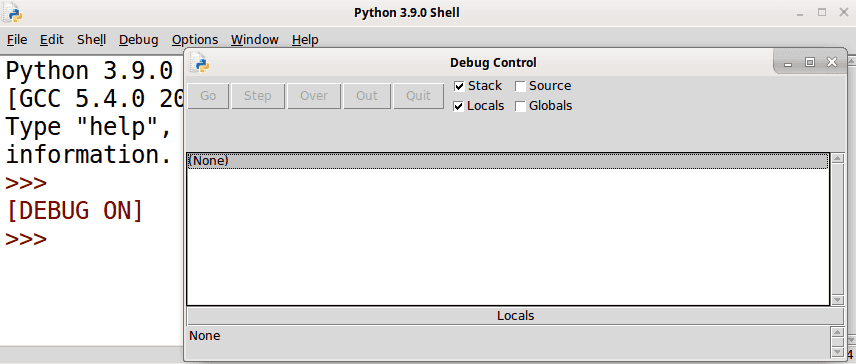
Then, with debug mode active, run the program. Use the buttons and options to go over the code. Variable values will be automatically available, as shown below.

You can right-click on a line from the text editor to set/clear breakpoints.
See realpython: Debug With IDLE for a more detailed tutorial.

Latest comments (0)