Sometime in 2016, car and ridesharing services were suddenly joined by e-scooters, mopeds, and bicycles for rent on the corner. And, of course, more car and ridesharing concepts joined them in the following years. New Mobility startups have set the plan to simplify people’s journeys. While they can make a crucial contribution to lowering emissions by a personal car traveling, it’s not as simple as it seemed at first ten years ago. The companies’ big bet is that people will use the services to get to the closest public transport hub or to cover short distances in cities (intermodality). In the long run, this will develop into a network of options that will motivate people to give up their privately owned cars since sharing vehicles are more reliable, cheaper, and more trustworthy than driving their cars. You can expect the twist coming! And for developers and data scientists, we provide a guide on using the Kuwala software framework that solves some issues in this article.
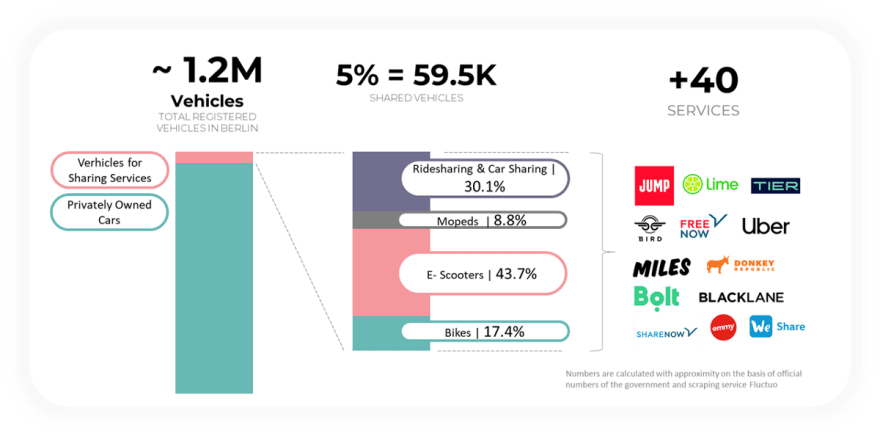
In fact, people love the service of Uber or Tier, but the hoped-for effect fails to convert into the big vision. Uber leads to congested streets in New York because individuals do not give up their own vehicles. An e-scooter is moved just five times per day. So on average, an e-scooter is used for just 60–80 minutes. There are currently about 60,000 sharing vehicles in Berlin (distributed among more than 40 regional and global players). On the other hand, there are over 1.2 million vehicles, with new registrations of privately owned cars at a 5-year high and an increase of 1.1% (YoY Growth). Therefore, it will take more sharing offerings that are also more frequently used to achieve measurable success and the profitability of the companies.
Matti and I still believe that the hype around New Mobility was not just hot air. Maybe also because we are working with one of the few profitable car-sharing services in the industry. The two key goals of utilization and profitability go hand in hand with the utopian goal of traffic transformation and a profitable business. The goal can be further operationalized in this regard:
- Vehicle availability and distribution must be optimized to be located precisely where they are needed in terms of actual demand.
- Vehicle maintenance and recharging times must be optimized so that the short-term loss of missing vehicles on the road is not noticeable.
- Service areas must be chosen to balance intermodality, coverage, and profitability in new and existing markets.
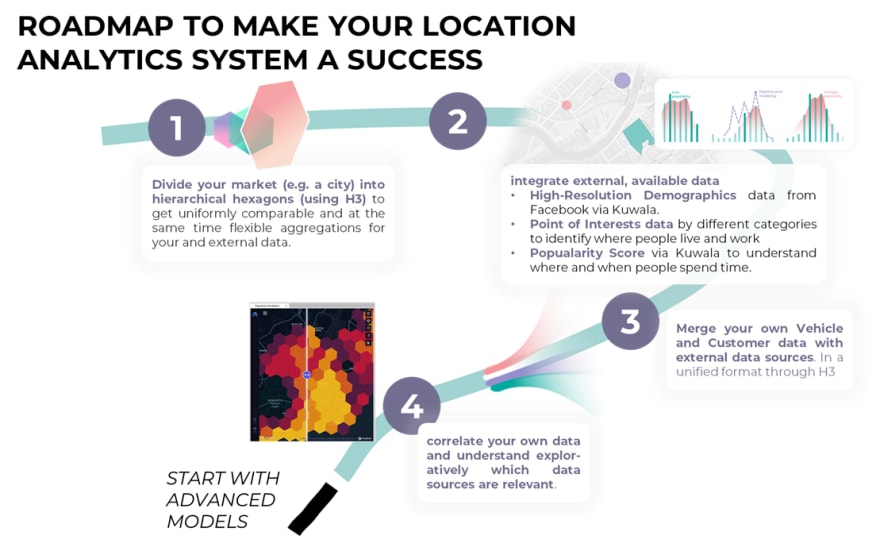
But how can you turn a great idea into a profitable business? We think it takes a certain amount of data intelligence. It would be best to find out the theoretical maximum at a specific time in a particular place in a vast city like Berlin. Your gut feeling (the biggest neural network in the world) might not be too helpful in this case and leads to decisions with considerable opportunity costs. For this reason, it is essential to identify and estimate the actual demand with the help of data. Possible influencing factors are for example:
- Weather (many new mobility startups already use this source with success)
- Events such as concerts with an estimation of the number of people who need a ride.
- Total visitation frequency and popularity at places and locations on an hourly estimation.
- High-resolution demographics information to have finely graded adjustments instead of top-level decisions on a zip code level.
One company that has mastered external and dynamic data processing is Uber. It even incorporates data from electric toothbrushes into its predictions to dynamically adjust pricing and fleet distribution. However, not every company is Uber. Not every company manages to pay the brightest Data Scientists and develop their own prediction models. However, we believe that changing the mobility of people for good is only possible if all players can develop such algorithms. One thing in advance, we have already created something for you so that your mobility startup also has the possibility to make data-driven decisions with just one hands-on developer. Let us start with a little recipe that spots some challenges when starting with spatial mobility analytics.
Are you curious if it’s actually that easy? With Kuwala, we have already implemented exactly the case described above and looked at Lisbon as an example. We decided to correlate Uber traversals with the holistic popularity score through Kuwala. Everything we show you in the next paragraph is easy to reproduce with a well-set-up computer, Python3, Docker (and docker-compose), and not more than five lines of code. Since we talk data and give you the skills to run everything during a commercial break on TV, make sure to have 8GB RAM and 10GBs left on your hard disk.
Setup
- Clone our GitHub repository (https://github.com/kuwala-io/kuwala)
- Launch Docker in the background
- From inside the root directly run with Shell or GitBash
cd kuwala/scripts && sh initialize_core_components.sh && sh run_cli.sh
- Select to download the demo data
- Now a Jupyter Notebook will open
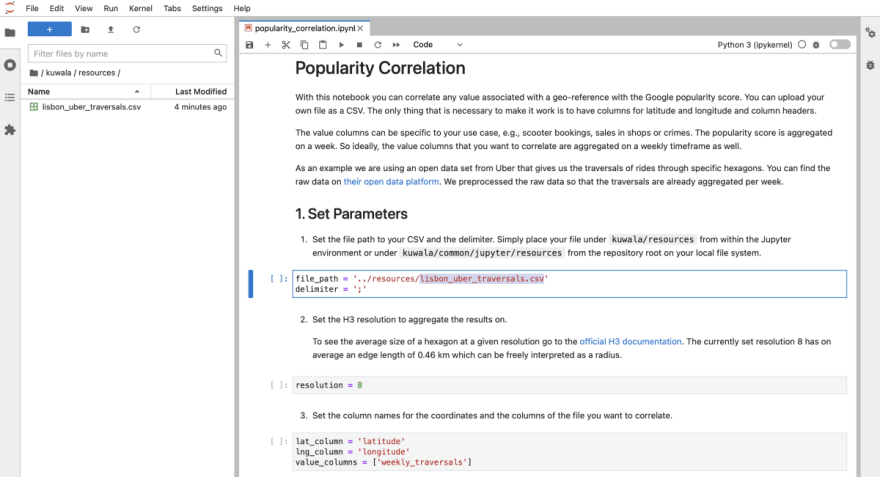
Launch and Analyze in Jupyter Notebook
The Jupyter Notebook will guide you now through the following analytical steps. Just execute the commands to get a feeling of the already integrated functions of data quality review, analytics, and visualization
- Load CSV with traversals
- Load popularity score for Lisbon
- Join data frames
- Data quality report with Pandas Profiling
- Correlation analysis between popularity score data of Lisbon and Uber traversals
- Launch a map for explorative results with the Unfolded.ai SDK
You want to replicate the results in a web environment? We have also hosted the complete example on Binder. No Installation is needed and you just run the commands to get a first impression: https://bit.ly/3nX0Wq6.
Learn to adjust Kuwala to your use case, region, and data...
Now it’s your turn. With the built-in CLI of Kuwala, you can populate the three external data pipelines, namely, Point-of-Interest data, popularity score, and high-resolution demographics into a local database.
- Run CLI
- Select pipelines
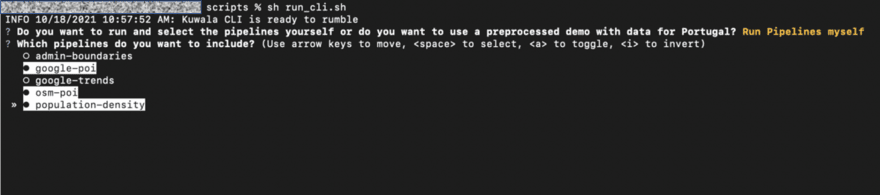
- Populate in database
- Integrate your own data
- Query with the Jupyter Notebook
Where do we go from here? Kuwala is an open-source project, and therefore we live from other developers using our tools, giving feedback, and developing further. For example, we would love to integrate weather data or other data sources. You can contact us directly or join our Slack community. For interested mobility or location-based startups, we are happy to evaluate how quickly we can build a scaled system together into your company. In any case, get in touch one way or the other.
For additional content from Kuwala, we recommend our weekly podcast episodes , which you can also find below!


Top comments (0)
Some comments may only be visible to logged-in visitors. Sign in to view all comments.