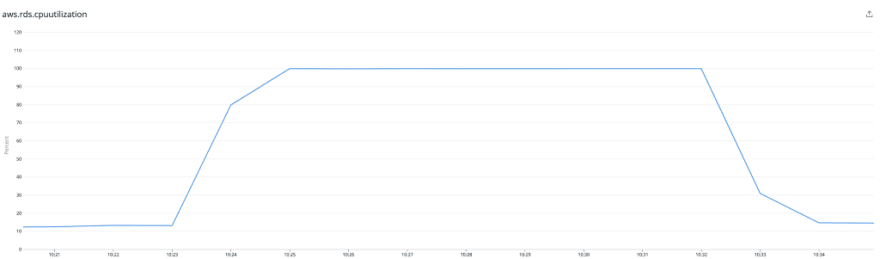
High CPU utilization on Aurora RDS
In one of my previous articles, I discuss some interesting ways we can troubleshoot high local storage utilization on Amazon Aurora PostgreSQL. In this article, I share some thoughts on troubleshooting high CPU utilization as well as some best practices for Amazon Aurora PostgreSQL.
Keep it Simple
PostgreSQL built-in extensions pg_stat_statements, pg_stat_activity, and pg_stat_user_tables are great starting points and can quickly help you gather insights around your top SQL, missing indexes, gather insights into locking and identify blocked queries along with blocking PID's/queries.
https://medium.com/media/2f24ca9c7a72fe833d90317710c48f82/hrefSlow Query Logging
For heavy and concurrent workloads, slow query logging could provide you with some great insights. Go ahead and turn on your slow logs but make sure to set up some reasonable thresholds just so that you catch enough. Note that logging all statements could have a huge impact on performance as well as result in high resource utilization. Logging lock waits could also be a useful addition to see if lock waits were contributing to your performance issues.
# Example that logs statements executing for > 500ms.
log_min_duration_statement=500

# Useful in determining if lock waits are causing poor performance
log_lock_waits=1
Follow up with EXPLAIN ANALYZE and look for improvements.
Some pointers for you to look for:
- Look for a difference in estimated vs actual rows.
- No index, wrong index (cardinality)
- Large no of buffers read (check on the working-set and if it fits under shared_buffers)
- A large no of rows filtered by a post join predicate.
- Reading more data than necessary (pruning, clustering, index-only)
- Look for slow nodes in your plans (SORT[AGG], NOT IN, OR, large seq_scans, CTEs, COUNT, function usage in filters, etc.)
Note that sequential scans in some cases may be faster than an index scan specifically when the SELECT returns more than approximately 5–10% of all rows in the table. This is because an index scan requires several IO operations for each row whereas a sequential scan only requires a single IO for each row or even less because a block (page) on the disk contains more than one row, so more than one row can be fetched with a single IO operation. More bounded queries are better to inform the optimizer and can help pick the right scan strategy.
Analyzing the plan could be overwhelming sometimes and could use tools such as dalibo and depesz that help visualize your explain plans (Make sure to read the data retention policies on these tools and ideally anonymize your queries for security reasons before you upload your plans)!
Performance Insights
Turning on Performance Insights on your Aurora PostgreSQL cluster is another great way to get detailed insights into your performance and resource utilization. With Performance Insights, you have a quick way to slice your queries by top SQL, top wait, etc, and can come in handy to continually monitor your production workloads.

Performance Insights showing high CPU utilization sliced by top SQL.
Another great metric dimension to look at would be to look at waits and identify where your database may be spending the most time. Metrics are broken down below by Top SQL and sorted by the top wait.

Performance Insights showing metrics sliced by top SQL and wait.
If you need a good overview and understanding of Performance Insights I highly recommend watching the talk on Performance Insights at AWS re:Invent.
Configuration
shared_buffers
One of the common pitfalls with setting shared_buffers very large is that the memory is nailed down for page caching, and can’t be used for other purposes, such as temporary memory for sorts, hashing, and materialization (work_mem) or vacuuming and index build (maintenance_work_mem).
If you can’t fit your entire workload within shared_buffers, then there are a number of reasons to keep it relatively small. If the working set is larger than shared_buffers, most buffer accesses will miss the database buffer cache and fault a page in from the OS; clearly, it makes no sense to allocate a large amount of memory to a cache with a low hit rate.
https://medium.com/media/1d635554846d95a294535ffb62d847dd/hrefwal_buffers
PostgreSQL backend processes initially write their write-ahead log records into these buffers, and then the buffers are flushed to the disk. Once the contents of any given 8kB buffer are durably on disk, the buffer can be reused. Since insertions and writes are both sequential, the WAL buffers are in effect a ring buffer, with insertions filling the buffer and WAL flushes draining it. Performance suffers when the buffer fills up and no more WAL can be inserted until the current flush is complete. The effects are mitigated by the fact that, when synchronous_commit is not turned off, every transaction commit waits for its WAL record to be flushed to disk; thus, with small transactions at low concurrency levels, a large buffer is not critical. With PostgreSQL 14 you can now get more insights into your wal_buffers with pg_stat_wal.
Below you can see a high CPU but also high WAL:write which could provide us some hints to tune the database further such as setting aside some extra memory for the wal_buffers.

Performance Insights showing metrics sliced by top waits.
random_page_cost
Defaults to 4. Storage that has a low random read cost relative to sequential, such as solid-state drives could be better modeled with a lower value for random_page_cost, e.g. 1.0. Best to configure Aurora databases with 1.0 and measure improvements.
work_mem, max_parallel_workers_per_gather
For a complex query, several sort or hash operations may be running in parallel. Also, several running sessions could be doing such operations concurrently. Therefore, the total memory used could be many times the value of work_mem and should be tuned appropriately. Setting in too low or too high could have an impact on performance. The default(4MB) for OLTP workloads is a good starting point. It can be increased to a much higher value for non-OLTP workloads.
Similarly, a parallel query using 4 workers may use up to 5 times as much CPU time, memory, I/O bandwidth, and so forth. Defaults to 2. Recommended configuration formax_parallel_workers_per_gather for highly concurrent OLTP workloads spanning several connections is to set to 0 or turn off. For low concurrency, the defaults may suffice. May want to increase slowly and evaluate performance for non-OLTP workloads.
Prevent The Bloat
The importance of removing dead tuples is twofold. Dead tuples not only decrease space utilization but can also lead to database performance issues. When a table has a large number of dead tuples, its size grows much more than it actually needs — usually called bloat. A bloat results in a cascading effect on your database such as a sequential scan on a bloated table has more pages to go through, costing additional I/O and taking longer, a bloated index results in more unnecessary I/O fetches, thus slowing down index lookup and scanning, etc.
For databases that have high volumes of write operations, the growth rate of dead tuples can be high. In addition, the default configuration of autovacuum_max_workers is 3. Recommend monitoring the bloat on the database by inspecting dead tuples across your tables that deal with high concurrency.
-- monitor dead tuples
SELECT relname, n_dead_tup FROM pg_stat_user_tables;

-- monitor auto vacuum
SELECT relname, last_vacuum, last_autovacuum FROM pg_stat_user_tables;
While increasing autovacuum_max_workers maybe needed in some cases it also means increasing resource utilization. Careful tuning might result in overall performance improvement by cleaning up dead tuples faster and being able to keep up.
Write Amplification, fillfactor, and HOT Updates
“ fillfactor for a table is a percentage between 10 and 100. 100 (complete packing) is the default. When a smaller fillfactor is specified, INSERT operations pack table pages only to the indicated percentage; the remaining space on each page is reserved for updating rows on that page”
In a scenario when a row is updated and at least one of the indexed columns is part of the updated columns, PostgreSQL needs to update all indexes on the table to point to the latest version of the row. This phenomenon is called write amplification (also one of the biggest architectural challenges with PostgreSQL to not used clustered indexes that affect performance).
Heap-only Tuples ( HOT ) updates are an efficient way to prevent write amplification within PostgreSQL. Lowering the fillfactor can have a positive impact by increasing the percentage of HOT updates. A lower fillfactor can stimulate more HOT updates i.e. fewer write operations. Since we write less we also generate fewer WAL writes. Another benefit of HOT updates is that they ease the maintenance tasks on the table. After performing a HOT update, the old and new versions of the row are on the same page. This makes the single page cleanup more efficient and the vacuum operation has less work to do.
HOT updates help to limit table and index bloat. Since HOT updates do not update the index at all, we don’t add any bloat to the indexes.
-- review your fillFactor
SELECT
 pc.relname AS ObjectName,
    pc.reloptions AS ObjectOptions
FROM pg_class AS pc
INNER JOIN pg_namespace AS pns
 ON pns.oid = pc.relnamespace
WHERE pns.nspname = 'public';
HOT comes with some performance trade-offs that affect read performance for index scans. So carefully reduce the fillfactor (such as 85%) on tables that get a lot of updates and measure performance differences!
Hoping something like the zheap storage engine initiative should help us get past these bottlenecks in the future. Until then we may not be able to prevent the bloat but could certainly minimize the impact.
Enhanced Monitoring

Turning on Enhanced Monitoring can provide you with useful insights at the database host level as well as the process list. Specifically useful if you have to track down a specific process (PID) consuming a lot of CPU and map that to pg_stat_activity for more details on the query. Also gives you a great metric dimension for comparing Read/Write IOPS, memory, etc. to CPU utilization.
Query Plan Management (QPM)
A major cause of response time variability is query plan instability. There are various factors that can unexpectedly change the execution plan of queries. For example:
- Change in optimizer statistics (manually or automatically)
- Changes to the query planner configuration parameters
- Changes to the schema, such as adding a new index
- Changes to the bind variables used in the query
- Minor version or major version upgrades to the PostgreSQL database version. (Analyze operation isn’t performed after the upgrade to refresh the pg_statistic table?)
- Planner configuration options such as default_statistics_target, from_collapse_limit, join_collapse_limit etc.
QPM is a great feature that allows us to manage query plans, prevent plan regressions and improve plan stability. QPM collects plan statistics and allows us the controls needed to approve plans that have a lower cost estimate and/or let Aurora adapt to run the plan with minimal cost automatically.
QPM is available on Amazon Aurora PostgreSQL version 10.5-compatible (Aurora 2.1.0) and later and can be enabled in production (minimal overhead) and or enabled/disabled against your test working-sets with tools such as sysbench. I highly recommend turning this on under your test environments and also practice plan evolution (reviewing and approving plans) before applying QPM in production. Once applied to production a periodic review will be necessary to see if the optimizer has found better plans with a lower cost estimate that needs to be approved.
Anomaly Detection
CPU or resource utilization on your database server that is predictable and can be repeatable for testing purposes are usually easier to deal with and be tuned for performance. The issues that happen once in a while or are not repeatable will need a more careful inspection of metrics and some tools to troubleshoot.
AWS DevOps Guru is one of the alternatives that is ML-based and used to identify anomalies such as increased latency, error rates, and resource constraints and then send alerts with a description and actionable recommendations for remediation. From a database perspective, you could for example alert on high-load wait events (based on the db_load metric) and CPU capacity exceeded. In addition, DevOps Guru can catch anomalies in logs which is a useful feature to have. For example, you could now alert on any abnormal error rate seen in PostgreSQL logs.
Amazon Aurora on PostgreSQL 14
Amazon Aurora announced support for PostgreSQL major version 14 (14.3) recently! PostgreSQL 14 includes performance improvements for parallel queries, heavily-concurrent workloads, partitioned tables, logical replication, and vacuuming. In addition, this release includes enhancements to observability, developer experience, and security.
For workloads that use many connections, the PostgreSQL 14 upgrade has achieved an improvement of 2x on some benchmarks. Heavy workloads, and workloads with many small write operations, also benefit from the new ability to pipeline queries to a database, which can boost performance over high-latency connections. This client-side feature can be used with any modern PostgreSQL database with the version 14 client or a client driver built with version 14 of libpq.
Another big plus in PostgreSQL 14 is that dead tuples are automatically detected and removed even between vacuums, allowing for a reduced number of page splits, which in turn reduces index bloat.
For distributed workloads, the use of logical replication can stream in-progress transactions to subscribers, with performance benefits for applying large transactions.
Please refer to Amazon Aurora PostgreSQL updates for more information.
Right Sizing and Alternative Architecture Patterns
In some cases, you may have a reasonably optimized database and queries but are still looking to find that extra bit of performance improvement. You have a number of choices you could make to better manage your workloads, and improve performance and resource utilization. Often times this means Right Sizing your database, database upgrades, or even choosing a better architecture for your applications. Check out my previous post on Right Sizing for some recommendations on this and more!
Conclusion
Try to keep things simple and start with the built-in tools and extensions available with your database engine on the cloud to quickly pinpoint and fix resource utilization issues. Continue to monitor your databases with slow logs, Cloudwatch, Performance Insights, Enhanced Monitoring, DevOps Guru, or an APM of your choice. Last but not least reduce bloat to have a bigger impact on performance overall. While this post is mostly centered around Aurora PostgreSQL you could achieve similar insights on Aurora Mysql as well as RDS. Lastly, I want to leave some useful references for you to read up on this topic. Good Luck!
References
- Troubleshoot high CPU utilization for Amazon RDS or Aurora for PostgreSQL
- A Case Study of Tuning Autovacuum in Amazon RDS for PostgreSQL | Amazon Web Services
- Amazon DevOps Guru for RDS under the hood | Amazon Web Services
- Amazon Aurora: Design Considerations + On Avoiding Distributed Consensus for I/Os, Commits, and Membership Changes
- Amazon Aurora now supports PostgreSQL 14
- Introduction to Aurora PostgreSQL Query Plan Management | Amazon Web Services
- Fighting PostgreSQL write amplification with HOT updates
- zheap: Reinvented PostgreSQL storage - CYBERTEC
Thank you to my co-workers Sasha Mandich and Francislainy Campos for their feedback on this post!

Top comments (0)