
The standard Command Line Interface for Kubernetes (kubectl) is a very powerful tool for debugging or monitoring purposes. It is very inefficient, but just if you want to get a high-level overview of your Kubernetes cluster or want to work with multiple resources at the same time.
A large number of graphical Kubernetes dashboards exist today and chances are that you already used the default Kubernetes dashboard or the one that comes with your cloud provider. All of these dashboards are similar in the way they group information (a simple hierarchy for namespaces/resources) and cannot be easily used for answering generic questions regarding your cluster.
As an example, let’s say that you have a large Kubernetes cluster and you want to answer questions such as the following in a timely manner:
- Can you quickly locate all pods that don’t have resource limits?
- Can you quickly find role-bindings that are not actively used?
- Can you quickly find which namespace gets the most resources in the cluster?
- Can you quickly locate which images use the “latest” tag?
When faced with these questions, cluster operators are typically faced with a choice. Either you can spend a lot of time with kubectl (the familiar play-10-questions game) or you can create ad hoc scripts or tools that probe the cluster and try to find these specific issues.
Wouldn’t it be nice if a graphical tool could answer these questions for you right away? Wouldn't it also be even nicer if you could input your own questions on the spot instead of creating ad hoc scripts and tools whenever a new question comes up?
This missing graphical tool is Kubevious. You can see a live demo of it at https://demo.kubevious.io/ or see its source code at https://github.com/kubevious/kubevious
Rethinking the capabilities of a Kubernetes dashboard
Kubevious is a new Kubernetes dashboard that is a bit smarter when it comes to reasoning about Kubernetes resources. It has many groundbreaking features, but in this post, we will focus on its powerful rule engine that allows you to search and mark Kubernetes resources according to custom rules.

Kubevious has a hierarchical layout that will be familiar to you as it groups objects per namespace and hangs them in a tree structure directly under a namespace. The true magic happens, however, when you realize that Kubevious is performing extra analysis on each type of resource and “marks” it according to built-in or custom rules.
For example, out of the box, you will see a “spy” icon on objects that have API access to the cluster itself outside of their own namespace.
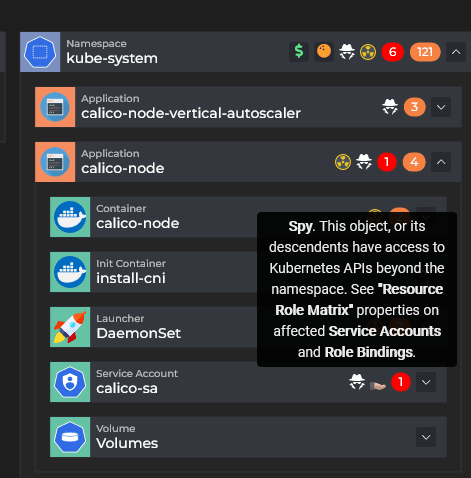
Having this type of information readily available on big clusters is very important as it cuts down considerably the amount of time spent on manual kubectl commands.
Kubevious has several other built-in markers that you might find useful. As an example you can find easily unused cluster bindings:
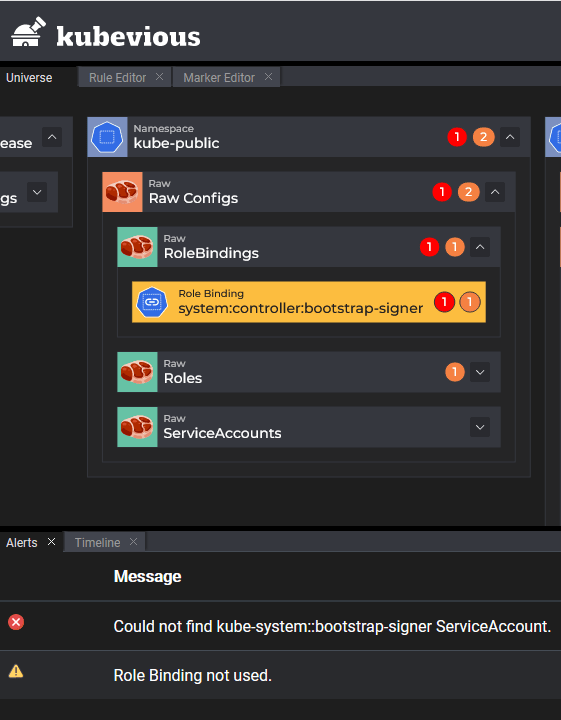
More importantly, it also allows you to create your own rules for your specific business needs.
Reasoning about Kubernetes resources
Kubevious comes with its own rule engine that allows you to locate Kubernetes resources with the characteristics that you define. The rule Editor is also part of the GUI:
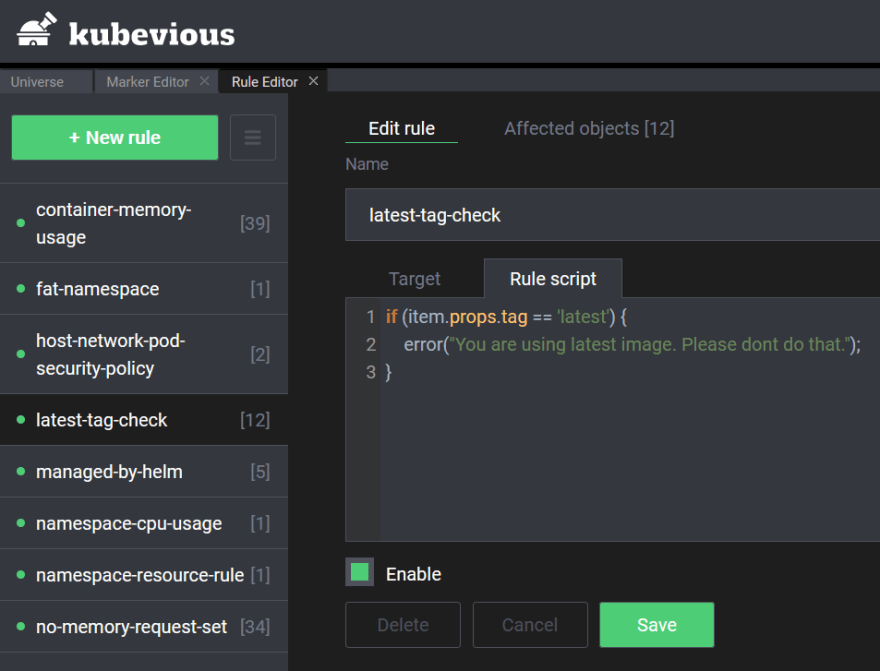
Each rule is defined in a simple language called Kubik with a Javascript-like syntax. For each rule, you define the body of the rule (what Kubernetes resource to look for) along with a marker (what to do with the affected resource). Markers are a combination of icon, name, and color that you can use to tag affected objects.
There is already a library of existing rules that you can reuse in your cluster. For example, you can quickly locate pods without resource limits:
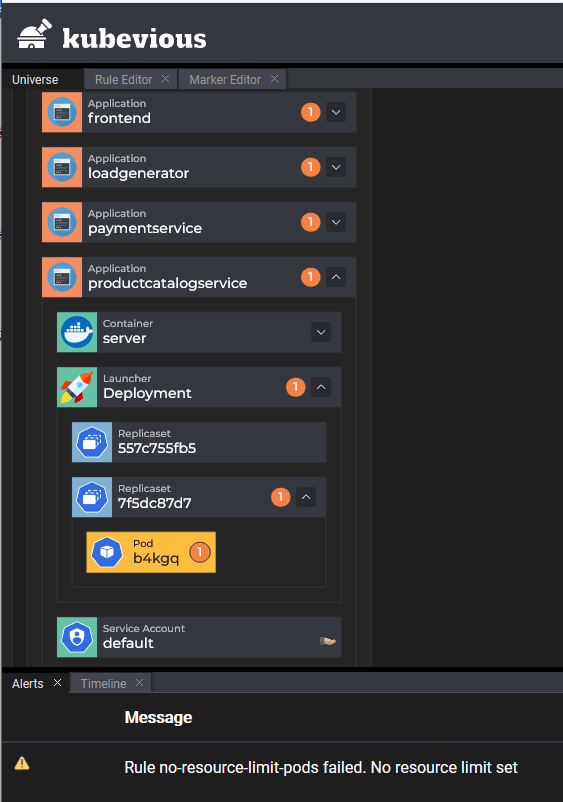
Here is the rule definition:
for(var container of item.config.spec.containers)
{
  if (!container.resources.limit)
  {
    warning('No resource limit set');
  }
}
As another example let’s find a namespace with resources that eat more that 40% of CPU or memory
select('Namespace')
    .filter(({item}) => {
        const cpu = item.getProperties('cluster-consumption').cpu;
        const memory = item.getProperties('cluster-consumption').memory;
        return (unit.percentage(cpu) >= 40) ||
                          (unit.percentage(memory) >= 40);
    })
Rules are edited with the live editor from the GUI and saved instantly on the cluster itself. No additional tool is needed for managing rules.
You can find more information about the Rule Engine on the documentation page.
Cross-checks and resource correlations
The other impressive feature of Kubevious is the correlation between different Kubernetes resources. After you create a rule that matches a certain number of resources, you don’t have to manually scroll your viewport trying to find which of them are a match.
The rule GUI provides you with a direct report on what resources are affected.

Clicking on any of the affected resources focuses the dashboard on that resource.
This correlation capability is ever-present in several other facilities of Kubevious. For example, if Kubevious can detect shared data between certain resources it will allow you to see all of them in a single place.
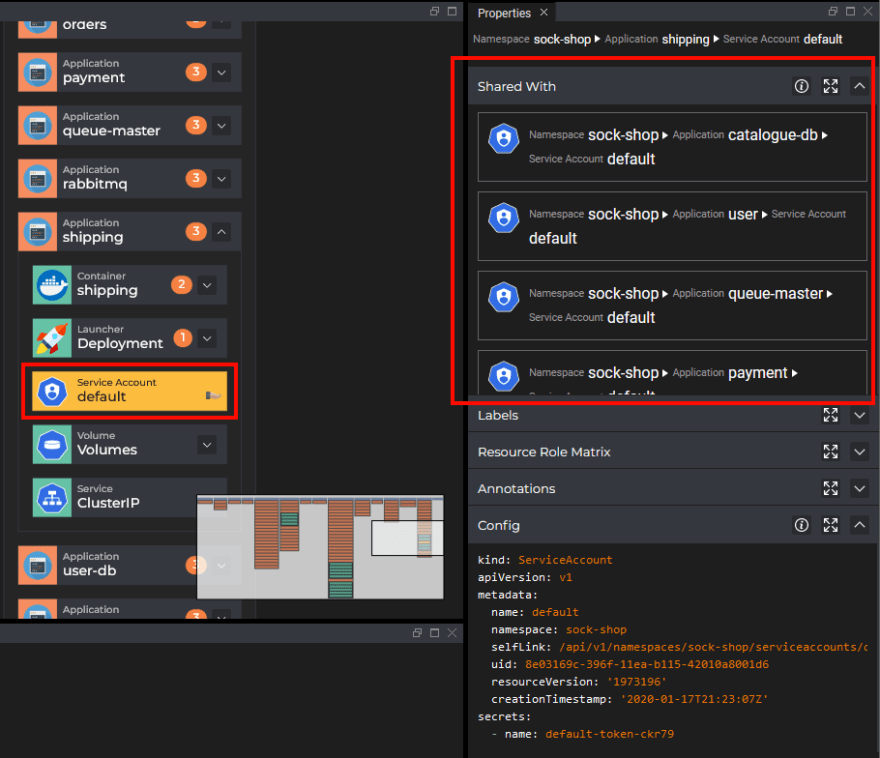
This feature makes it very easy to see the “blast radius” of your changes. One very common configuration issue with deployments is changing a setting/resource and not understanding all the other applications it will affect. Seeing beforehand what will be affected after a configuration change is a very welcome feature that makes navigating a large cluster much easier.
Conclusion
The rules engine is just one of the features offered by Kubevious. Kubevious has several other interesting features such as a full-text search for all cluster resources as well as a time machine for detecting configuration changes. If you manage big clusters and don’t want to play the questions game with kubectl anymore, then Kubevious is straightforward to install and monitor in your cluster.
Visit the https://kubevious.io/ website for more information.


Top comments (0)