
In the previous article, I demonstrated how Application Insights SDK sends telemetry data. In this article, I explain how Application Map feature works and how to distinguish multiple servers.
Application Map
Most of the applications are consist of multiple components such as web servers, databases, blob storages, 3rd party Web API, etc. When I have this complex setup, I can use Application Map to not only visualize the relationship of each components, but also understand and troubleshoot performance and errors on each components.
Application Insights SDK is intelligent enough to auto track the dependencies to illustrate this, and I can also explicitly send dependency information.
See Application Map: Triage Distributed Applications for more detail.
Default behavior
I use similar code from previous article.
var appInsights = require("applicationinsights");
appInsights.setup("<instrumentation_key>").start();
var client = appInsights.defaultClient;

var express = require('express');
var app = express();

app.get('/', (req, res) => {
    let customMetric = Math.random() * 50 + 50;
    client.trackEvent({ name: "my custom event", properties: { customProperty: "my custom event" } });
    client.trackMetric({ name: "custom metric", value: customMetric}); // generate metric [50, 100]

    res.send(customMetric.toString());
});

app.listen(8888);
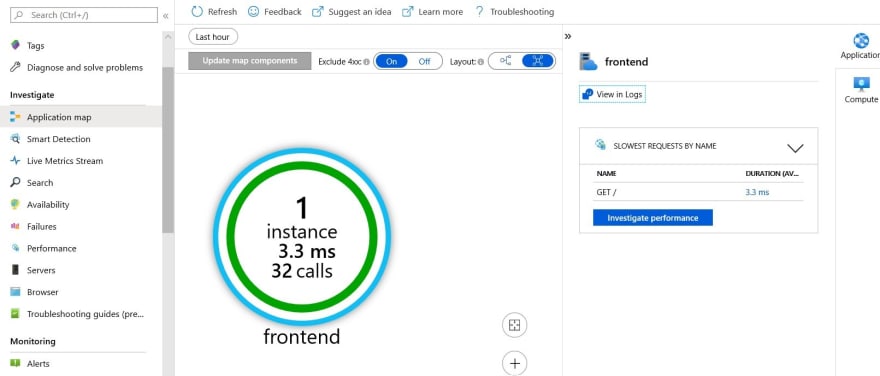
After I run and send telemetry to Application Insights, it detect the node.js application as "Web"

This is because I omit the following code which I included in the original sample.
appInsights.defaultClient.addTelemetryProcessor(envelope => {
    envelope.tags["ai.cloud.role"] = "myapp";
    envelope.tags["ai.cloud.roleInstance"] = "myapp1"
});
- Role: Any string is accepted. If it's web application and works as front end server, then I can say "Frontend"
- Role Instance: I may have several servers for HA or simple scale out scenario.
I can specify instance name for each server to distinguish them.
Explicitly specify names
Now, let's update the application to use following tag.
appInsights.defaultClient.addTelemetryProcessor(envelope => {
    envelope.tags["ai.cloud.role"] = "frontend";
    envelope.tags["ai.cloud.roleInstance"] = "frontend-1"
});
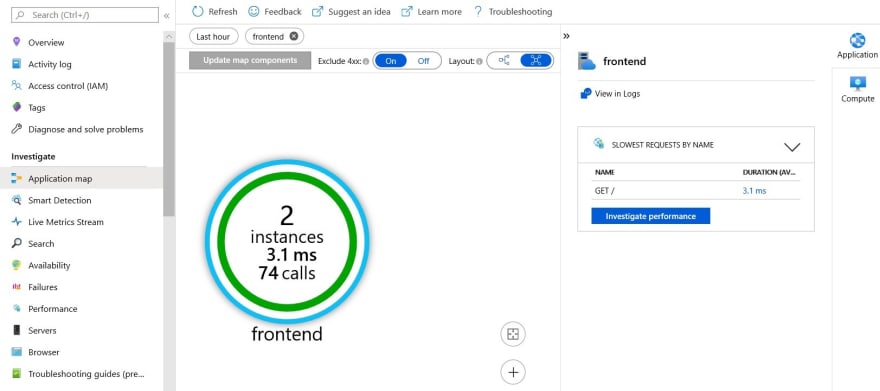
Then, it displays by using the specified name. (It doesn't update old logs so it should be set from the first time)
If I add another server as "frontend-2", then it shows I have 2 instances of "frontend" role.
Add dependency
I updated the application to use Azure Storage (kenakamuaistorage). Obviously the code is far from perfect but it should be enough to just illustrate the behavior.
var appInsights = require("applicationinsights");
appInsights.setup("<instrumentation_key>").start();
var client = appInsights.defaultClient;
appInsights.defaultClient.addTelemetryProcessor(envelope => {
    envelope.tags["ai.cloud.role"] = "frontend";
    envelope.tags["ai.cloud.roleInstance"] = "frontend-1";
});

var express = require("express");
var azureStorage = require("azure-storage");
var tableService = azureStorage.createTableService(
    "kenakamuaistorage",
    "<storage_key>"
);

var app = express();

app.get('/', (req, res) => {
    let customMetric = Math.random() * 50 + 50;
    client.trackEvent({ name: "my custom event", properties: { customProperty: "my custom event" } });
    client.trackMetric({ name: "custom metric", value: customMetric}); // generate metric [50, 100]

    res.send(customMetric.toString());
});

app.get("/:p/:r", (req, res) => {
    tableService.retrieveEntity("mytable", req.params.p, req.params.r, (err, result, response) => {
        if (!err) {
            res.send(`${result.PartitionKey._} - ${result.RowKey._}`);
        } else {
            res.send("No data");
        }
    });
});

app.listen(8888);
I also created two rows in my table account like below.

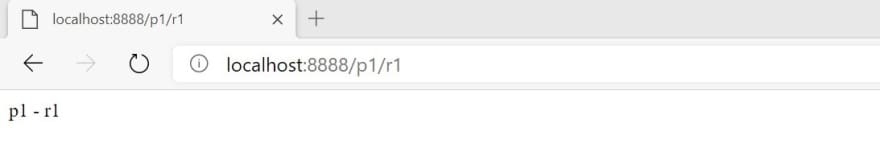
Now I can see the record by accessing address like /p1/r1 or /p1/r2
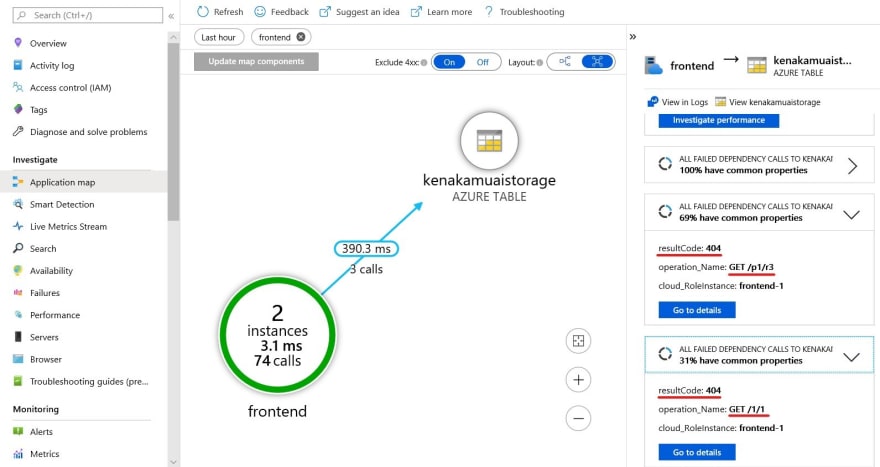
Then Application Insights shows the component relationship like below.

If I want to see more detail about the storage call, then I simply click the lines between "frontend" and "AZURE TABLE". Then I can see the failed dependency.
I clearly see the URL causes the issue as I don't have row in table with such keys.
When I click "Go to details", I can see End to end transaction which gives me more detail to troubleshoot.
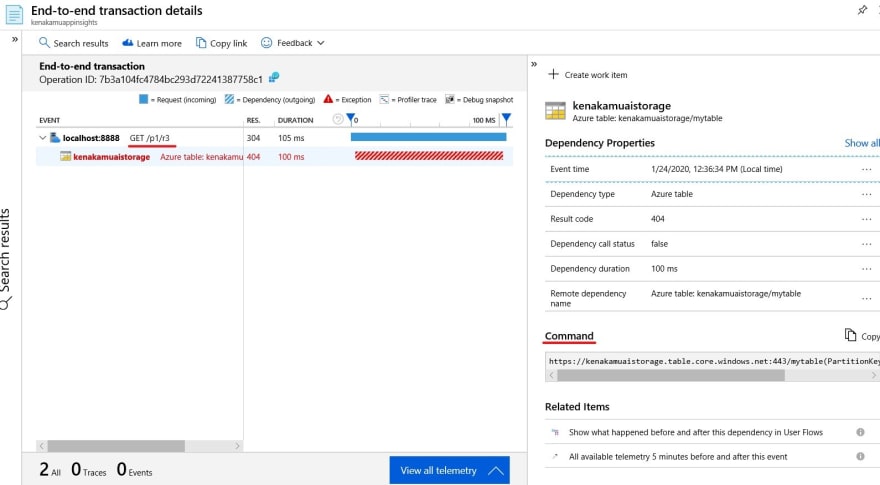
The interesting part is that the web application didn't fail as I handle error and return "No data". Yet Application Insights tells me what happens behind the scene which is awesome.
Manually Add Dependencies.
The reason why Application Insights can track the detail dependency to Azure Storage without explicit settings is that it knows Azure. So what happens if I need to call my own legacy application?
I can use TrackDependency function to track it manully.
I added following endpoint to illustrate this. I can set several key elements:
- target: role name
- name: the event name of dependency
- data: log the actual operation
- duration: log the duration the operation took
- resultCode/success: log the result status
- dependencyTypeName: Application Type name like "AZURE TABLE"
app.get("/orders", (req, res) => {
    client.trackDependency({
        target: "mydatabase",
        name: "select orders table in mydatabase",
        data: "SELECT * FROM Orders",
        duration: 231,
        resultCode: 1,
        success: true,
        dependencyTypeName: "MyDatabase"
    });
    res.send("there are many orders!");
});

app.get("/ordersfail", (req, res) => {
    client.trackDependency({
        target: "mydatabase",
        name: "select orders table in mydatabase",
        data: "SELECT * FROM Orders",
        duration: 1024,
        resultCode: -1,
        success: false,
        dependencyTypeName: "MyDatabase"
    });
    res.send("something went wrong :(");
});
When I hit both endpoints, I get expected results.

Application Insights displays components as below. It's shows average performance and failure rate. In this case, I made 7 calls and 3 calls were failed. (42.9%). Target and Type are also correctly shown.

When I click the line between frontend and mydatabase, I see more detail such as status code and operation.

The "End-to-end transaction details" shows dependency property exactly same I set in the code. (Duration becomes seconds, not milliseconds)

Failures and Performance
I can drill down to failure and performance from Application map, but I also have direct access to these information from "Investigate" menu.

Summary
Although I am a developer, I am GUI guy, too. I really like how Application Insights shows the map which is not only easy to understand but also easy to troubleshoot.
In the next article, I go back to SDK detail and talk about Out of box telemetries!

Top comments (0)