This is the third and final part of the series on Using Istio, a Service Mesh, with Amazon Elastic Kubernetes Service (EKS). In the last two articles, we discussed various topics. These include what Service Mesh is, what Istio is, what technologies we used, the prerequisites and architecture overview, reviewed the Terraform code used to deploy the AWS resources and successfully deployed the Terraform Code to AWS. We also installed the the Istio CLI tool, istioctl, ran the "configure.sh" script to configure the Flux Repository, and installed Flux to the Amazon EKS cluster. Finally, we reviewed the Addons and Applications managed by Flux, discussed the Istio Components and Addons used by Istio, and reviewed how Istio works with Applications and Microservices.
In this final and third article, we will cover the following topics.
- Access the Applications managed by Flux
- Demonstrate how Istio works
- Review the Istio Addons
- Clean up apps and infrastructure
You can access the code in my GitHub Repository.
Access Applications managed by Flux
Let's access the Applications managed by Flux. Retrieve the public_base_domain_name specified in the "locals.tf" when you ran Terraform earlier.
Access Bookinfo App
For the Bookinfo App, you can access the Bookinfo URL "https://bookinfo./productpage" in your favorite web browser.
Access Podinfo App
For the Podinfo App, you can access the Podinfo URL "https://podinfo." in your favorite web browser.
Access Istio Addons
Let's access the Istio Addons before we demonstrate how Istio works. Retrieve the public_base_domain_name specified in the "locals.tf" when you ran Terraform earlier.
Access Kiali Dashboard
To access the Kiali Dashboard, follow these steps.
-
Access the Kiali URL "https://kiali." in your favorite web browser.
-
Generate and retrieve token by running the following command
kubectl -n istio-system create token kiali-service-account -
Copy and paste the generated token from above to the Kiali Login page.
-
Log into the Kiali Dashboard.
Access Grafana Dashboard
To access the Grafana Dashboard, follow these steps.
- Access the Kiali URL "https://grafana." in your favorite web browser.
- Log into Grafana with the following username and password.
- Username: admin
- Password: Grafana&Git0ps
Demonstrate how Istio works
Now that we know how to access the Applications let's demonstrate how Istio works. We will send several requests to the Bookinfo and Podinfo applications by running curl commands from the terminals or shells. We will do this to simulate enough traffic for Istio and the Istio Addons to capture the network traffic so the dashboards in Kiali and Grafana can display correctly.
Populate Data for Kiali and Istio Dashboards in Grafana
Retrieve the public_base_domain_name specified in the "locals.tf" when you ran Terraform earlier.
Open two separate terminals or shells.
NOTE: Run these commands as often as you want to populate the data in Kiali and Grafana.
-
Run the following command in the first terminal or shell to send traffic to the Bookinfo application. Replace with the actual domain name.
for i in {1..720}; do curl -s -o /dev/null "https://bookinfo.<public_base_domain_name>/productpage" ; done -
In the second terminal or shell, run the following command to send traffic to the Podinfo application. Replace with the actual domain name.
for i in {1..720}; do curl -s -o /dev/null "https://podinfo.<public_base_domain_name>" ; done
It will take 4 to 5 minutes for the above commands to finish.
Access and Review Data in Kiali Dashboard
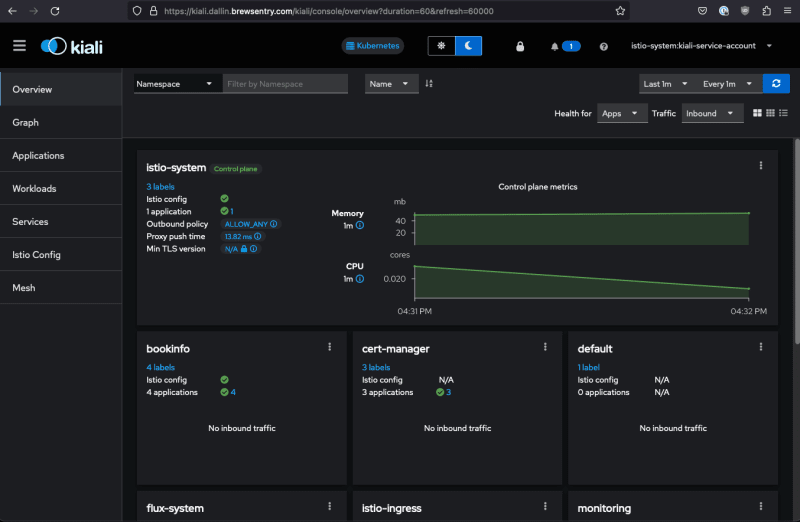
While the commands above run, re-access the Kiali Dashboard and review the data.
-
Let's change the time range to the last 10 minutes by clicking in the upper right corner of the web page. Click on "Last 1m" to "Last 10m".
-
Click on "Graph" on the left side of the Kiali Dashboard.
-
Click on "Select Namespaces" and choose "bookinfo".
-
Click anywhere on the Kiali Dashboard, and you should see something similar.
-
Click on "Display" and select "Response Time" and "Security".
-
Click anywhere on the Kiali Dashboard again, and you should see the response times and a little green lock on each connection.
-
Click on "productpage v1" on the Kiali Graph Dashboard, and you should see something like this. It will display information on the right-hand side of the Dashboard, such as Traffic and Traces.
-
Let's add the podinfo namespace to the Kiali Graph Dashboard. Click Namespace again and then podinfo. After selecting, you should see something like this.
Feel free to explore other parts of the Kiali Dashboard. The Kiali Dashboard pulls its data from Prometheus, Grafana, and Jaeger.
Access Istio Dashboards in Grafana
Let's re-access the Grafana Dashboards for Istio and review the data. For details on what each Istio Dashboard does, click here.
NOTE: If the data is not showing in the Grafana Dashboards for Istio, re-run the commands from above to populate data for Bookinfo and Podinfo again.
-
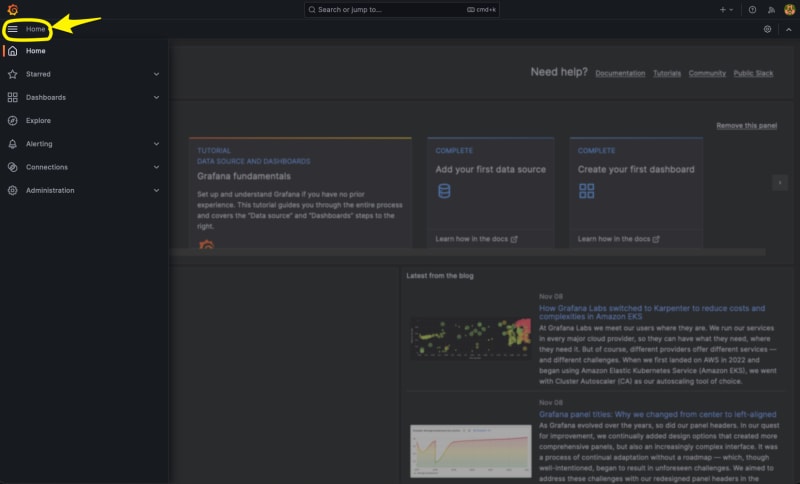
Change to the Istio Dashboards in Grafana by clicking on Home in the upper left of the Grafana home page
-
Click on Dashboards
-
Hover over Istio and then click "Go to folder".
-
Istio Dashboards should now appear.
-
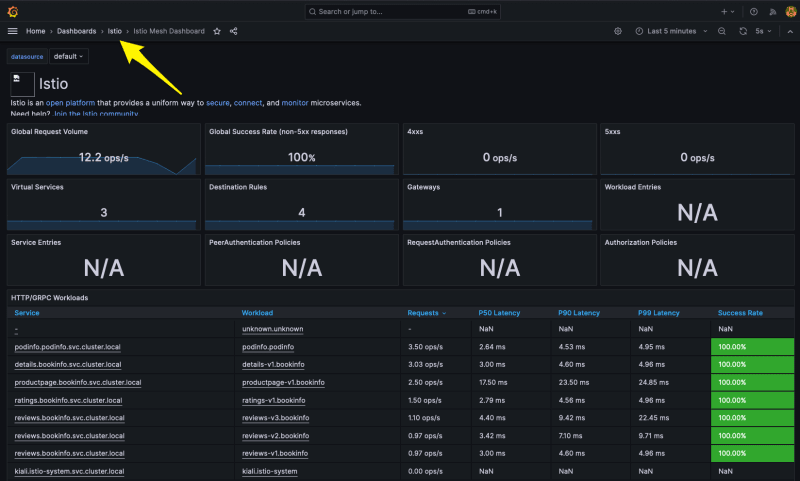
Click on Istio Mesh Dashboard In Grafana. This dashboard provides a global view of all services and applications used in the Service Mesh.
-
Let's navigate to the Istio Service Dashboard by clicking on Istio in the upper left-right next to "Home > Dashboards > Istio" and then click "Istio Service Dashboard".
-
Click on service on the Istio Service Dashboard and change to "productpage.bookinfo.svc.cluster.local" service and then expand General, Client Workloads, and Service Workloads sections.
-
Review the General, Client Workloads, and Service Workloads sections. In the Client Workloads and Service Workloads sections, you can see that mutual TLS (mTLS) is enabled and working correctly.
Feel free to explore other parts of the Istio Dashboards in Grafana.
Clean Up
Clean up Applications managed by Flux from Kubernetes
-
Suspend Applications managed by Flux
flux suspend source git flux-system flux suspend kustomization apps flux-system \ monitoring-controllers monitoring-configs -
Delete Applications managed by Flux
kubectl delete -f ./k8s/apps/base/bookinfo/config.yaml
kubectl delete -f ./k8s/apps/base/bookinfo/cert_request.yaml
kubectl delete -f ./k8s/apps/base/podinfo/config.yaml
kubectl delete -f ./k8s/apps/base/podinfo/cert_request.yaml
kubectl delete -f ./k8s/apps/base/bookinfo/release.yaml
flux delete helmrelease -s podinfo
flux delete helmrelease -s -n monitoring loki-stack
flux delete helmrelease -s -n monitoring kube-prometheus-stack
Wait 1 to 5 minutes for Applications to be removed from Kubernetes
-
Delete Application sources managed by Flux
flux delete source helm -s podinfo flux delete source helm -s -n monitoring grafana-charts flux delete source helm -s -n monitoring prometheus-community -
Verify Applications are removed
kubectl -n bookinfo get all
kubectl -n istio-ingress get ingresses bookinfo-ingress
kubectl -n podinfo get all
kubectl -n istio-ingress get ingresses podinfo-ingress
kubectl -n monitoring get all
Clean up Infrastructure Applications managed by Flux from Kubernetes
-
Suspend Infrastructure Applications managed by Flux
flux suspend kustomization infra-apps -
Delete Infrastructure Applications managed by Flux
kubectl delete -f ./k8s/infrastructure/apps/kiali/config.yaml --force=true --grace-period=0
kubectl delete -f ./k8s/infrastructure/apps/kiali/cert_request.yaml
kubectl patch kiali kiali -n istio-system -p '{"metadata":{"finalizers": []}}' --type=merge
kubectl delete kiali --all --all-namespaces
kubectl delete jaegers.jaegertracing.io -n observability jaeger
flux delete helmrelease -s kiali
flux delete helmrelease -s jaeger-operator
kubectl delete crd kialis.kiali.io
Wait 1 to 5 minutes for Kubernetes Addons to be removed from Kubernetes
-
Delete Application sources managed by Flux
flux delete source helm -s jaegertracing flux delete source helm -s kiali -
Verify Kubernetes Addons were removed successfully
kubectl -n kiali-operator get all
kubectl -n observability get all
kubectl -n istio-ingress get ingresses kiali-ingress
If any resources are not deleted, manually delete them.
Clean up Kubernetes Addons managed by Flux from Kubernetes
-
Suspend Kubernetes Addons managed by Flux
flux suspend kustomization infra-configs infra-controllers -
Delete Kubernetes Addons managed by Flux
flux delete helmrelease -s aws-load-balancer-controller
flux delete helmrelease -s cert-manager
flux delete helmrelease -s cluster-autoscaler
flux delete helmrelease -s external-dns
flux delete helmrelease -s istio-base
flux delete helmrelease -s istiod
flux delete helmrelease -s istio-ingressgateway
flux delete helmrelease -s metrics-server
Wait 1 to 5 minutes for Kubernetes Addons to be removed from Kubernetes
-
Delete Application sources managed by Flux
flux delete source helm -s cert-manager flux delete source helm -s cluster-autoscaler flux delete source helm -s eks-charts flux delete source helm -s external-dns flux delete source helm -s istio flux delete source helm -s jetstack flux delete source helm -s metrics-server -
Verify Kubernetes Addons were removed successfully
kubectl -n kube-system get all -l app.kubernetes.io/name=external-dns
kubectl -n kube-system get all -l app.kubernetes.io/name=aws-load-balancer-controller
kubectl -n kube-system get all -l app.kubernetes.io/name=aws-cluster-autoscaler
kubectl -n cert-manager get all
kubectl -n istio-ingress get ingresses kiali-ingress
kubectl -n istio-ingress get all
kubectl -n istio-system get all
kubectl get ingressclasses -l app.kubernetes.io/name=aws-load-balancer-controller
If any resources are not deleted, manually delete them.
Uninstall Flux from Kubernetes
-
Uninstall Flux
flux uninstall -s -
Verify Flux was removed successfully
kubectl get all -n flux-system
Clean up Terraform
-
Navigate to the root of the directory of the GitHub repo and run the following commands
cd terraform terraform destroy -
Check Terraform destroy results
Conclusion
In conclusion, this guide provided a comprehensive overview of utilizing Istio, a service mesh, and Amazon EKS. A service mesh is an essential infrastructure component that enhances communication and operational capabilities within a microservices architecture. Istio, as a leading service mesh implementation, provides a robust set of features for traffic management, security, and observability without heavy lifting from developers. Istio works seamlessly with Amazon EKS, as EKS supports Kubernetes natively, and Istio is designed to work with Kubernetes-managed services. Users can leverage Istio within EKS to manage microservices traffic, enforce security policies, and observe communication patterns between services, all while taking advantage of the managed Kubernetes environment that EKS provides. This combination allows for a powerful, scalable, and secure system for managing microservices at scale.


Top comments (0)