I want to share this article created by me, where you can find an explanation about what is OpenTelemetry and a tutorial to learn how to implement it in golang
Working With OpenTelemetry and Golang
Getting started

In this article, I will show you the basic code you will need to configure and work with stats. For this little tutorial, we are going to use Opentelemetry to integrate our golang code and in order to visualize it we are going to use Jeager.
Before starting let me give you a brief description of what Opentelemetry is.
What is Opentelemetry?
OpenTelemetry is an open-source project designed to facilitate the observability and traceability of microservices and distributed applications. Providing a standardized way to implement, generate records and collect metrics of our services, and can be implemented in different programming languages.
One of its main goals is to solve the challenge of collecting telemetry data from distributed systems in a consistent and reliable way. And how does Opentelemetry accomplish that?, well, this technology provides libraries and tools that allow developers to automatically add instrumentation to their applications and components, making it easy to generate and collect telemetry data, as could be, information about response times, latency, errors, execution traces, and performance metrics.
Note:
You can find more information about Opentelemetry in the following official link
https://opentelemetry.io/docs/what-is-opentelemetry/

The other technology that I mentioned above is Jaeger. Although it is not the central topic of this post, we are going to use it to visualize the collected telemetry data.
Jaeger is an open-source traceability platform used for monitoring and debugging distributed systems. Provide tracking and tracing capabilities for requests as they propagate across multiple services in a dispatcher environment.
Its main function is to capture, store and display detailed information about the flow of requests in a distributed system. This includes information about the runtime, dependencies, and performance of individual components and the interactions between them.
Note:
You can find more information about Jeager in the official web site https://www.jaegertracing.io/docs/1.45/
Implementation Time!
Now that you have an understanding of what OpenTelemetry and Jeagre are is time to build 2 simple applications.
The first one shows us and we going to learn how to configure PpenTelemetry in our golang application by running a couple of functions. Here we going to see how the traces works and how to visualize them on Jeager.
The second one is an implementation for a service based on gin-gonic framework.
Let us go !
The first that we need is to run an instance of Jeager, in this case, we going to use Docker to make it easy.
Jaeger provides a distribution all-in-one that we can use for our tutorial.
docker run -d --name jaeger \
  -e COLLECTOR_ZIPKIN_HOST_PORT=:9411 \
  -e COLLECTOR_OTLP_ENABLED=true \
  -p 6831:6831/udp \
  -p 6832:6832/udp \
  -p 5778:5778 \
  -p 16686:16686 \
  -p 4317:4317 \
  -p 4318:4318 \
  -p 14250:14250 \
  -p 14268:14268 \
  -p 14269:14269 \
  -p 9411:9411 \
  jaegertracing/all-in-one:1.45
Note: For productive environments, you should make the proper configurations according to your needs.
After running and building the container you can access Jaeger in the following link http://127.0.0.1:16686/search.
You will see a page like the following:

Keep it running and let us go to the coding.
Integrating Opentelemetry
Let us start with a simple example:
We need the following dependencies:
"go.opentelemetry.io/otel"
"go.opentelemetry.io/otel/exporters/jaeger"
You will need to configure the application to send the telemetry data to Jaeger. This function creates the exporter using the default Jaeger URL:PORT.
I will try to add good comments to guide you to understand the code.
First, define these couple of const, we going to use them in the function that configures the open telemetry and exporters.
Service: Help us to identify who is generating the spans.
environment: Help us to group the service spans by deployment, production, test, and development, by example.
-
id: Help us to identify the span group
const (
service = "medium-tutorial"
environment = "development"
id = 1
)
and then the function:
func tracerProvider() (*tracesdk.TracerProvider, error) {
 // Create the Jaeger exporter
 exp, err := jaeger.New(jaeger.WithCollectorEndpoint())
 if err != nil {
  return nil, err
 }
 tp := tracesdk.NewTracerProvider(
  // Always be sure to batch in production.
  tracesdk.WithBatcher(exp),
  // Record information about this application in a Resource.
  tracesdk.WithResource(resource.NewWithAttributes(
   semconv.SchemaURL,
   semconv.ServiceName(service),
   attribute.String("environment", environment),
   attribute.Int64("ID", id),
  )),
 )
 return tp, nil
}
As you can see there we are creating the exporter, in time, we are using Jeager (you can see the complete list of exporters on the official site). After that we start to configure the Tracer Provider, there we going to define params like the exporter, the serviceName which helps to identify the metrics on Jaeger and useful params like the environment that help us to identify the deployment.
For the main method, we need to define something like this code example:
tp, err := tracerProvider()
 if err != nil {
  log.Fatal(err)
 }

 // Register our TracerProvider as the global so any imported
 // instrumentation in the future will default to using it.
 otel.SetTracerProvider(tp)

 ctx, cancel := context.WithCancel(context.Background())
 defer cancel()

 // Cleanly shutdown and flush telemetry when the application exits.
 defer func(ctx context.Context) {
  // Do not make the application hang when it is shutdown.
  ctx, cancel = context.WithTimeout(ctx, time.Second*5)
  defer cancel()
  if err := tp.Shutdown(ctx); err != nil {
   log.Fatal(err)
  }
 }(ctx)

 tr := tp.Tracer("component-main")
 ctx, span := tr.Start(ctx, "foo")
 defer span.End()
The code is not complicated we just make use of the function that creates the connection, and then we need to create a context.
Our metrics start here:
tr := tp.Tracer("component-main")
ctx, span := tr.Start(ctx, "foo")
defer span.End()
Those lines will help us to start the spans, the tracer is component main and the span is foo, and as you can see we catch the context, that is because we going to use that context to group the spans. (don’t worry I will show you the result in Jaeger)
And finally, this is the complete code:
package main

import (
 "context"
 "fmt"
 "log"
 "time"

 "go.opentelemetry.io/otel"
 "go.opentelemetry.io/otel/attribute"
 "go.opentelemetry.io/otel/exporters/jaeger"
 "go.opentelemetry.io/otel/sdk/resource"
 tracesdk "go.opentelemetry.io/otel/sdk/trace"
 semconv "go.opentelemetry.io/otel/semconv/v1.17.0"
)

const (
 service     = "medium-tutorial"
 environment = "development"
 id          = 1
)

// tracerProvider returns an OpenTelemetry TracerProvider configured to use
// the Jaeger exporter that will send spans to the provided url. The returned
// TracerProvider will also use a Resource configured with all the information
// about the application.
func tracerProvider() (*tracesdk.TracerProvider, error) {
 // Create the Jaeger exporter
 exp, err := jaeger.New(jaeger.WithCollectorEndpoint())
 if err != nil {
  return nil, err
 }
 tp := tracesdk.NewTracerProvider(
  // Always be sure to batch in production.
  tracesdk.WithBatcher(exp),
  // Record information about this application in a Resource.
  tracesdk.WithResource(resource.NewWithAttributes(
   semconv.SchemaURL,
   semconv.ServiceName(service),
   attribute.String("environment", environment),
   attribute.Int64("ID", id),
  )),
 )
 return tp, nil
}

func main() {
 tp, err := tracerProvider()
 if err != nil {
  log.Fatal(err)
 }

 // Register our TracerProvider as the global so any imported
 // instrumentation in the future will default to using it.
 otel.SetTracerProvider(tp)

 ctx, cancel := context.WithCancel(context.Background())
 defer cancel()

 // Cleanly shutdown and flush telemetry when the application exits.
 defer func(ctx context.Context) {
  // Do not make the application hang when it is shutdown.
  ctx, cancel = context.WithTimeout(ctx, time.Second*5)
  defer cancel()
  if err := tp.Shutdown(ctx); err != nil {
   log.Fatal(err)
  }
 }(ctx)

 tr := tp.Tracer("component-main")
 ctx, span := tr.Start(ctx, "foo")
 defer span.End()

 bar(ctx)

 time.Sleep(10 * time.Second)
}

func bar(ctx context.Context) {
 fmt.Println("on bar")
 tr := otel.Tracer("component-bar")
 _, span := tr.Start(ctx, "bar")
 span.SetAttributes(attribute.Key("medium_test").String("this is an attribute value"))
 defer span.End()

 time.Sleep(200 * time.Millisecond)

}
If we run the program and then go to the Jaeger main page we can search by our stats by selecting the following params:
service: medium-tutorial
operations: all

In the image above you can see the current spans. If you click one of them you will see more information:

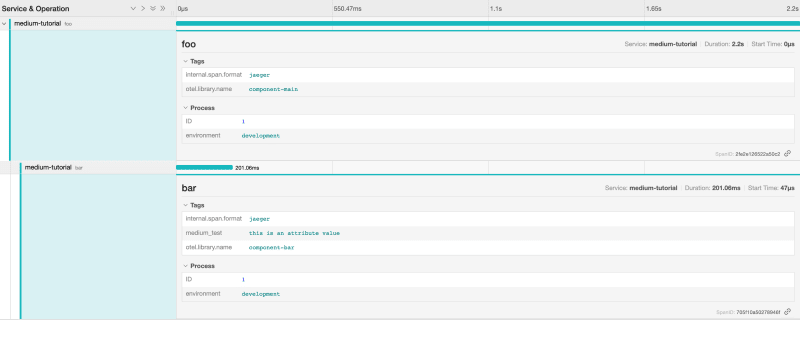
There you can see the commented lines above, you can visualize the spans and their child spans it is very helpful because you can trace all the propagation and flow of your logic. Other important metrics that you can visualize there are the times that takes each process (span) to be completed.
Here I want to let a note If you want to understand more about the span attributes I recommend you to review the official documentation this post is just a little tutorial.
Easy right, now that we know how to send spans and how to group them we can implement it to our gin-gonic implementation. Let us see how it looks.
Implementing open telemetry in a gin-gonic service
In the following code you will fine a simple implementation of open telemetry for gin-gonic, we can reuse the base configuration made to configure the exporter.
In addition in this code, you will learn how to handle go routines spans.
Let you here the complete code:
package main

import (
 "context"
 "fmt"
 "log"
 "net/http"
 "time"

 "github.com/gin-gonic/gin"

 "go.opentelemetry.io/contrib/instrumentation/github.com/gin-gonic/gin/otelgin"
 "go.opentelemetry.io/otel"
 "go.opentelemetry.io/otel/attribute"
 "go.opentelemetry.io/otel/exporters/jaeger"
 tracesdk "go.opentelemetry.io/otel/sdk/trace"

 "go.opentelemetry.io/otel/propagation"
 "go.opentelemetry.io/otel/sdk/resource"
 semconv "go.opentelemetry.io/otel/semconv/v1.17.0"
 oteltrace "go.opentelemetry.io/otel/trace"
)

const (
 service     = "medium-gin-server-test"
 environment = "development"
 id          = 1
)

var tracer = otel.Tracer(service)

func tracerProvider() (*tracesdk.TracerProvider, error) {
 // Create the Jaeger exporter
 exp, err := jaeger.New(jaeger.WithCollectorEndpoint())
 if err != nil {
  return nil, err
 }
 tp := tracesdk.NewTracerProvider(
  // Always be sure to batch in production.
  tracesdk.WithSampler(tracesdk.AlwaysSample()),
  tracesdk.WithBatcher(exp),
  tracesdk.WithResource(resource.NewWithAttributes(
   semconv.SchemaURL,
   semconv.ServiceName(service),
   attribute.String("environment", environment),
   attribute.Int64("ID", id),
  ),
  ),
 )

 // Register our TracerProvider as the global so any imported
 // instrumentation in the future will default to using it.
 otel.SetTracerProvider(tp)
 otel.SetTextMapPropagator(propagation.NewCompositeTextMapPropagator(propagation.TraceContext{}, propagation.Baggage{}))

 return tp, nil
}

func main() {

 fmt.Println("initializing")

 tp, err := tracerProvider()
 if err != nil {
  log.Fatal(err)
 }

 // Cleanly shutdown and flush telemetry when the application exits.
 defer func() {
  if err := tp.Shutdown(context.Background()); err != nil {
   log.Fatal(err)
  }
 }()

 r := gin.New()
 r.Use(otelgin.Middleware("my-server"))
 loadRoutes(r)

 r.Run()
}

func loadRoutes(r *gin.Engine) {
 r.GET("/ping", pingFunc)
}

func pingFunc(c *gin.Context) {

 ctx, span := tracer.Start(c.Request.Context(), "/ping", oteltrace.WithAttributes(attribute.String("hello", "the user")))
 defer span.End()

 bar(ctx)

 c.JSON(http.StatusOK, gin.H{
  "message": "pong",
 })
}

func ping2Func(c *gin.Context) {
 ctx, span := tracer.Start(c.Request.Context(), "/ping-2", oteltrace.WithAttributes(attribute.String("hello2", "the user 2")))
 defer span.End()

 bar(ctx)

 c.JSON(http.StatusOK, gin.H{
  "message": "pong",
 })
}

func bar(ctx context.Context) {
 fmt.Println("on bar")
 // Use the global TracerProvider.
 ct, span := tracer.Start(ctx, "bar")
 span.SetAttributes(attribute.Key("testset").String("value"))
 defer span.End()

 time.Sleep(1 * time.Millisecond)

 go bar3(ct)
}

func bar3(ctx context.Context) {
 fmt.Println("on bar 3")

 _, span := tracer.Start(ctx, "bar-3-on-goroutine")
 span.AddEvent("starting goroutine bar3")

 defer func() {
  span.End()
 }()
 span.AddEvent("executing logic")
 time.Sleep(1 * time.Second)

 span.AddEvent("completed goroutine bar3")
}
After running the code and make a request to the ping endpoint, you can go to Jaeger and search the spans.

That will show something like:

Then if you click on the result, you will be able to see all the span trace
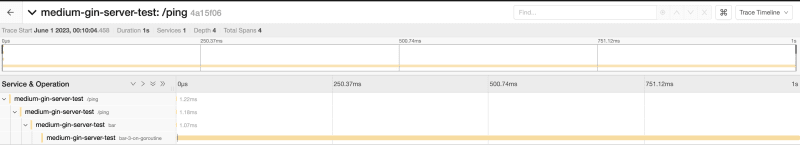

In this example, we can see the spans as a cascade, that is because as we are passing the context through the function calls we are generating the span hierarchy.
Now you can play with the code and make the modifications in order to understand more about the span trace.
As you saw isn’t complicated to integrate open-telemetry in our projects with a tool that helps us to visualize the traces and spans in an easy way.
You can use the code defined in our examples to start configuring your real-world service just adapting to your needs. As you can see, it is not complicated and is easy to understand.


Top comments (0)