Every developer knows this situation: You're writing your code, hammering your keyboard all day long. Your code seems to work. Until it doesn't. Either it's not working as expected at all or only in some situations.
You try to find the problem. You have a close look at the code. But nothing seems wrong! So why the heck is this happening?
With time you will have found debugging strategies to deal with these kinds of problems. You will have some intuition that tells you where to look.
But for beginners, code that's not working can feel like a black hole. You don't know where to start. You're poking around and maybe, if you're lucky, you find a solution. But that can take hours or days.
At the beginning of my career, it was always great to learn by watching more experienced people doing their work. This is why I want to share the way I debugged a problem that another developer had in their project.
Be aware that debugging is not always a linear process. All roads lead to Rome. Some developers have a very logical step by step debugging process. Some are rather chaotic and jump around to find leads.
You can read this post like a protocol of the debugging process for this particular problem. I recommend you follow along step by step for better understanding. Simply clone this repository as a starting point.
Heads-up: If you like this post get a free cheatsheet with lots of techniques for debugging React at the end of this post.
The issue
First of all, let's have a look at the application. It's a budgeting app that displays the expenses per category in a bar chart.
The component we need to investigate is the BarChart component.
import React, { useEffect, useState } from "react";
import axios from "axios";
import { ResponsiveBar } from "@nivo/bar";

const theme = {
  axis: {
    ticks: {
      line: {
        stroke: "#e9ecee",
        strokeWidth: 40
      },
      text: {
        fill: "black",
        fontFamily: "BlinkMacSystemFont",
        fontSize: 16
      }
    }
  },
  grid: {
    line: {
      stroke: "#e9ecee",
      strokeWidth: 5
    }
  },
  legends: {
    text: {
      fontFamily: "BlinkMacSystemFont"
    }
  }
};

function BarChart() {
  const [data, setData] = useState([]);

  useEffect(() => {
    axios
      .get('http://localhost:8080/spendings')
      .then((response) => setData(response.data));
  }, []);

  const getDollarAmount = (bar) => {
    console.log('getDollarAmount');
    const amountInDollar = bar.value * bar.data.total_budget;
    return `$${parseFloat(amountInDollar).toFixed(2)}`;
  }

  return (
    <div className="chart" style={{ height: "500px" }}>
      <h4 className="chart-title">Budget Performance</h4>
      <ResponsiveBar
        markers={[
          {
            axis: "x",
            value: 1,
            lineStyle: { stroke: "rgba(0, 0, 0, .35)", strokeWidth: 2 },
            legend: "Goal",
            legendOrientation: "horizontal",
            legendPosition: "top"
          }
        ]}
        enableGridX={false}
        gridXValues={[1]}
        enableGridY={false}
        data={data}
        keys={["budget_status", "over_budget"]}
        indexBy="category"
        margin={{ top: 25, right: 130, bottom: 50, left: 125 }}
        padding={0.3}
        layout="horizontal"
        colors={{ scheme: "set2" }}
        theme={theme}
        borderColor={{ from: "color", modifiers: [["darker", 1.6]] }}
        axisBottom={null}
        label={getDollarAmount}
        isInteractive={false}
      />
    </div>
  );
}

export default BarChart;
The BarChart component fetches data from a development server when it did mount. It saves the data to a state and renders it in a bar chart. This is what it looks like.
So what is the problem here? Seems to work all fine.
When you open the console in your Browser's dev tools you will see a lot of log statements from the getDollarAmount function. There are hundreds of them.
Something seems to be wrong. So let's start debugging!
Pinpointing the issue
First of all, let's try to pinpoint the problem. One possibility is that the component is rendered hundreds of times for some reason. Another reason might be that something inside the BarChart component is triggering this amount of calls to the getDollarAmount function.
Considering the possibility of unnecessary renders we should have a look at the parent component. This is the Dashboard component.
import React, { useState, useEffect } from 'react';
import Axios from 'axios';
import BarChart from './BarChart';

function Dashboard() {
  const [isLoading, setLoading] = useState(true);
  const [widgets, setWidgets] = useState([]);

  useEffect(() => {
    Axios
      .get('http://localhost:8080/widgets')
      .then((response) => setWidgets(response.data))
      .finally(() => setLoading(false));
  }, []);

  if (isLoading) {
    return <div>Loading...</div>;
  }

  return (
    <div>
      {widgets.includes('BarChart') && <BarChart />}
    </div>
  );
}

export default Dashboard;
It fetches some widgets from our development server while it's rendering a loading state. Once the data has arrived we render the BarChart component if it's included in the widget list.
Fair enough, I can't see any reason for a huge amount of re-rendering. But to be sure let's try to check the render function of the BarChart component anyway.
Our first option would be to set a breakpoint inside the BarChart component. This is usually the best way to see why a function is called and what its arguments are. But for render functions or asynchronous code, I mostly prefer console.log statements.
Thus the first step is to add a log statement to the BarChart component.
function BarChart() {
  console.log('render BarChart');
  const [data, setData] = useState([]);

  ...
}
Since we're at it already let's see where getDollarAmount is called. The only place seems to be the label prop of the ResponsiveBar component.
Let's add a log statement there as well.
function BarChart() {
  ...

  return (
    <div>
      <h4>...</h4>
      <ResponsiveBar
        ...
        label={d => console.log('label called') || getDollarAmount(d)}
      />
    </div>
  )
}
Note: Using the
||operator to add a log statement to a function prop is a great way to get around adding curly brackets.
To clean the console output a bit we remove the log statement from getDollarAmount. Let's see what happens now:
Clearly, the label prop is the winner. Why the heck is that?
Taking a detour
The author of this code mentioned that fetching the data inside the useEffect causes the problem. The code inside useEffect is executed once the component did mount. Thus it's equivalent to fetching data inside a class component's componentDidMount function.
Why should this be the problem? Sounds strange enough to be investigated, right? So let's remove the asynchronous axios call and set some mock data to the state immediately after the component did mount. We can simply take the mock data from the development server.
function BarChart() {
  const [data, setData] = useState([]);

  useEffect(() => {
    const response = {
      data: [
        {
          category: "Alcohol",
          budget_status: 0.0,
          over_budget: 0.0,
          total_budget: 180,
        },
        {
          category: "Clothing",
          budget_status: 0.0,
          over_budget: 0.0,
          total_budget: 200,
        },
        {
          category: "Dining",
          budget_status: 0.82,
          over_budget: 0.0,
          total_budget: 300,
        },
        {
          category: "Entertainment",
          budget_status: 0.02,
          over_budget: 0.0,
          total_budget: 210,
        },
        {
          category: "Fast Food",
          budget_status: 0.6,
          over_budget: 0.0,
          total_budget: 80,
        },
        {
          category: "Gas",
          budget_status: 0.24,
          over_budget: 0.0,
          total_budget: 320,
        },
        {
          category: "Groceries",
          budget_status: 1.0,
          over_budget: 0.26,
          total_budget: 850,
        }
      ]
    };
    setData(response.data);
  }, []);

  ...
}
Indeed, this fixes the problem as you can see here. There are only a couple of log statements label called left.
Interesting! But why is that? What effect did our change have?
Removing the API request causes setState to be called immediately when the component did mount. It's not moved to the task queue and executed during a later event loop anymore.
No idea how this is related to the problem though... but is the async call really causing it? We can test this either using setTimeout or Promise.resolve.
function BarChart() {
  const [data, setData] = useState([]);

  useEffect(() => {
    const response = { ... };
    Promise.resolve().then(() => setData(response.data));
  }, []);

  ...
}
Calling setData async really seems to cause the problem. That's confusing!
Taking a step back
It's not obvious what difference it should make whether we set the state directly or after a short delay. So let's take a step back and have another look at the BarChart component.
function BarChart() {
  const [data, setData] = useState([]);

  useEffect(() => {
    axios
      .get('http://localhost:8080/spendings')
      .then((response) => setData(response.data));
  }, []);

  const getDollarAmount = (bar) => {
    console.log('getDollarAmount');
    const amountInDollar = bar.value * bar.data.total_budget;
    return `$${parseFloat(amountInDollar).toFixed(2)}`;
  }

  return (
    <div className="chart" style={{ height: "500px" }}>
      <h4 className="chart-title">Budget Performance</h4>
      <ResponsiveBar
        markers={[
          {
            axis: "x",
            value: 1,
            lineStyle: { stroke: "rgba(0, 0, 0, .35)", strokeWidth: 2 },
            legend: "Goal",
            legendOrientation: "horizontal",
            legendPosition: "top"
          }
        ]}
        enableGridX={false}
        gridXValues={[1]}
        enableGridY={false}
        data={data}
        keys={["budget_status", "over_budget"]}
        indexBy="category"
        margin={{ top: 25, right: 130, bottom: 50, left: 125 }}
        padding={0.3}
        layout="horizontal"
        colors={{ scheme: "set2" }}
        theme={theme}
        borderColor={{ from: "color", modifiers: [["darker", 1.6]] }}
        axisBottom={null}
        label={getDollarAmount}
        isInteractive={false}
      />
    </div>
  );
}
We know that the getDollarAmount function is called by the ResponsiveBar label prop. What again was the ResponsiveBar component?
import { ResponsiveBar } from "@nivo/bar";
Okay, now it gets messy. The problem might be inside a third-party library. The component is imported from a third-party library called nivo. Never heard of it. Seems to help you with rendering data...
Investigating a third-party library's source code
When debugging npm packages you have two options: investigate the source code or try to debug on your local machine.
Investigating the source code seems easier for now. So where do we find the ResponsiveBar?
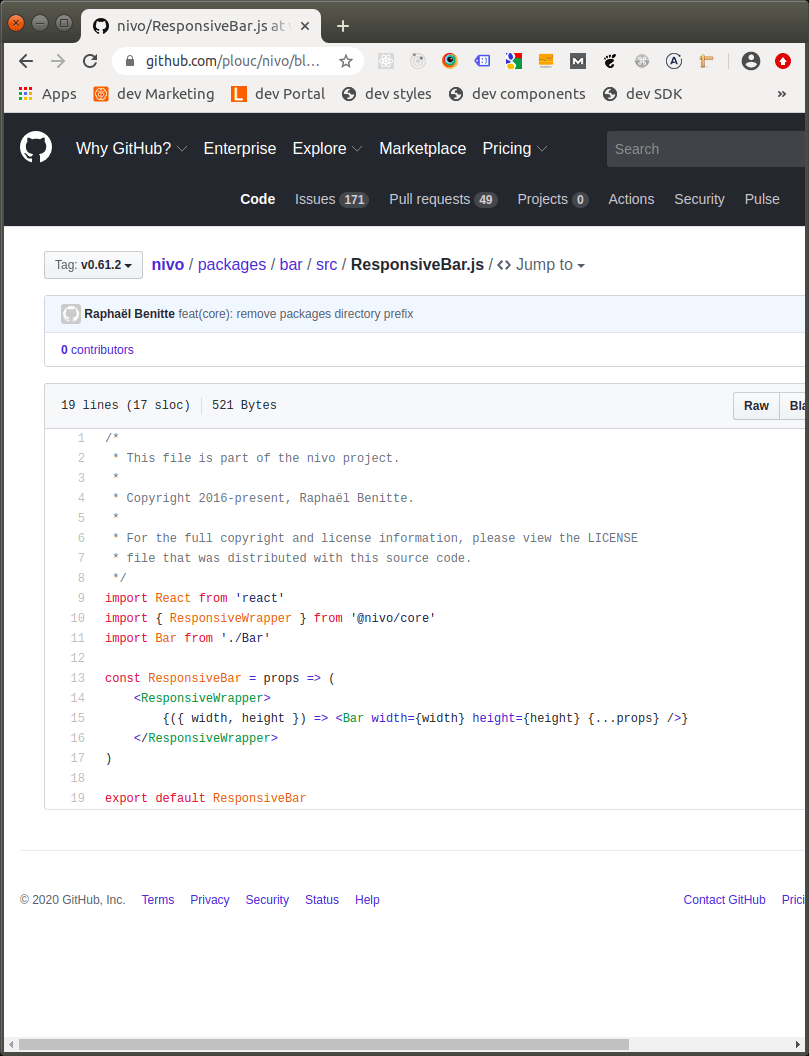
When you follow the link to the nivo package in the last section you will see this.
As a beginner, it's sometimes hard to find the source. With a bit of experience, this becomes easier though.
The packages folder seems most promising. When you open it you'll see a bar folder that again contains a src folder. Voila, there is the ResponsiveBar. Once you open it you'll see that it renders the Bar component inside a ResponsiveWrapper.
For now, let's focus on the Bar component.
Since we know that the label prop is responsible for the calls to getDollarAmount we'll search for "label" inside this file.
After looking around a bit it turns out there are two places where we have a label prop in the child components. One is rendered when the animate flag is true, the other when it's false.
Interestingly the name of the function that is called is not label but getLabel. We'll assume for now that the label prop we pass to ResponsiveBar component is somehow the same.
Debugging third-party libraries
By now we found out that the nivo ResponsiveBar component is responsible for the hundreds of calls of our getDollarAmount function. We also found out that the component accepts an animate prop (we might have known that by reading the docs as well...).
Now that we have a rough picture of how the ResponsiveBar works we can start debugging the nivo package on our machine. But how does that work?
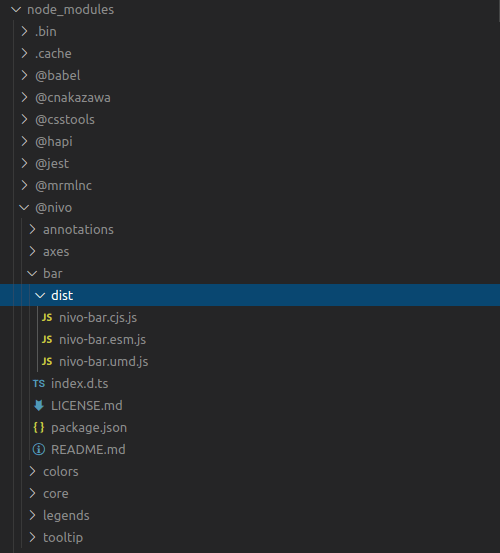
The source code of all the packages that we use lives inside the node_modules folder.
Inside the node_modules -> @nivo -> bar -> dist directory we can see three files, cjs, esm, and umd.
I probably should know better but I never remember which of those is used. How to find out? Simply open up every file, add a log statement to the Bar and see what happens.
So we open the nivo-bar.esm.js and see this:
Looks complicated! And there's a lot of code! That's because it's compiled.
We can be smart though and use the editor's search function. We know the name of the component we're interested in is Bar.
So let's search for function Bar with case matching. We get 4 results and the third one is a hit:
We add a log statement and save the file. Unfortunately, we have to realize that hot module reloading doesn't work.
That makes sense since webpack is probably not listening to node_modules. Let's give it another shot, open our BarChart component and save it. The React app refreshes but unfortunately no output in the console from any nivo-bar file.
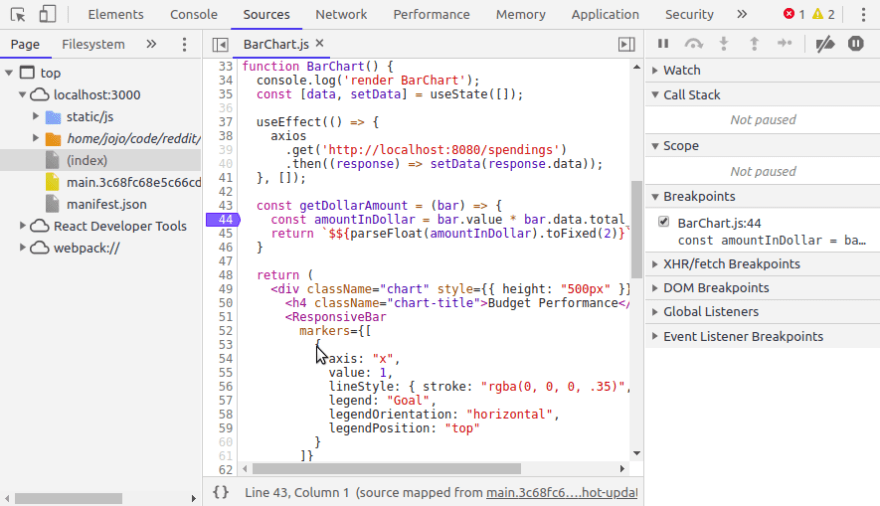
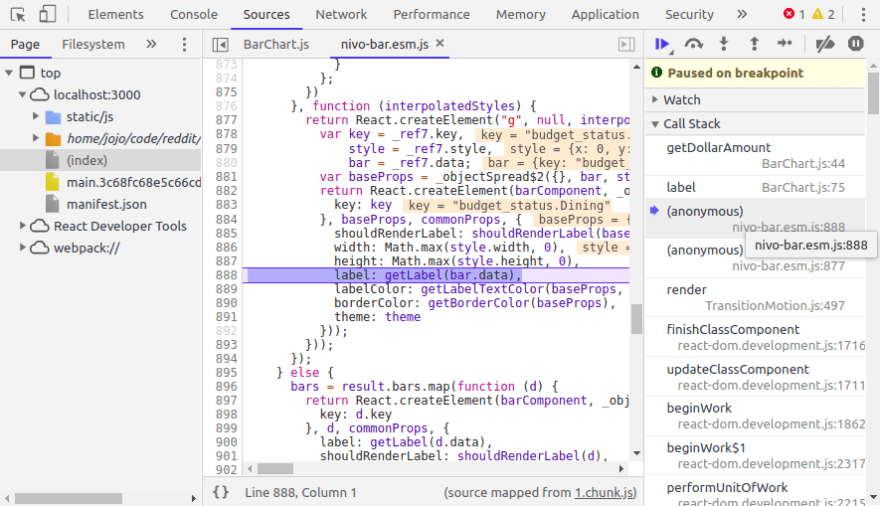
Wait a second... I guess there's a better idea: Why not add a breakpoint to the getDollarAmount function in our browser's dev tools. We should be able to trace the calling function back using the call stack.
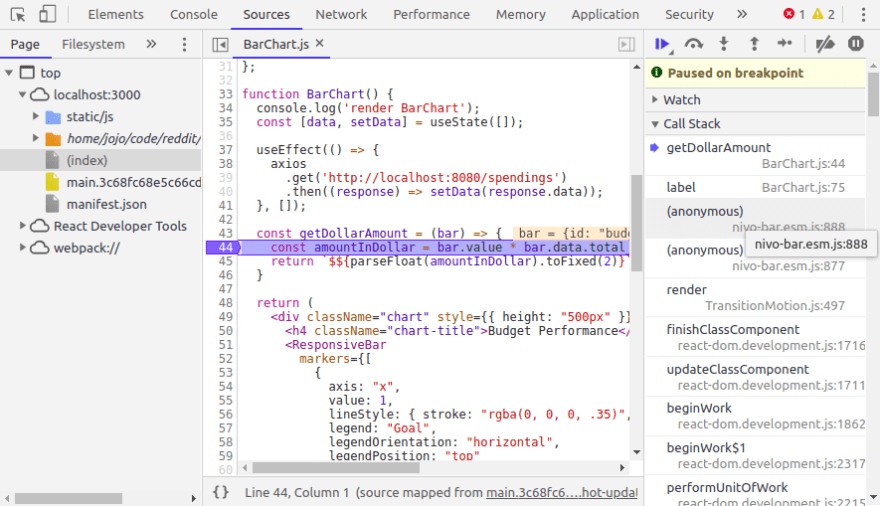
Now we can refresh the app and see what happens. The execution stops as expected at the breakpoint.
Great! Now we can see that the file we need to investigate is nivo-bar.esm.js. Let's click the first occurrence of that file on the call stack to see which line is responsible for calling our getDollarAmount function.
Makes sense. It's one of the label props that calls getLabel. More specifically it's the one that's called when the animate flag is true.
Next, we want to confirm that this is the code that's responsible for all the calls to getDollarAmount. One way to do that is to add a log statement at the right place inside nivo-bar.esm.js.
To find this place we select a piece of code that looks somewhat unique inside the dev tools. This line looks like a good candidate.
}, function (interpolatedStyles) {
We head back to our editor and open nivo-bar.esm.js. We enter the above line in the search.
Great! There is our getLabel call. Now let's add a hopefully final log statement just before the bar component is rendered.
We remove all previous log statements. We also remove the breakpoint inside getDollarAmount and add the log statement that we had there initially. We know already that hot module reloading is not working so we restart the app.
Now we open the browser and finally see the console output we were hoping for. Before every call of getDollarAmount the component that has the getLabel prop is rendered.
The hundreds of calls to getDollarAmount clearly are coming from the nivo Bar component.
What about the animate prop?
There is one last thing we might want to check. The animate prop of the ResponsiveBar component. What happens when we set it to false?
function BarChart() {
  ...

  return (
    <div>
      <h4>...</h4>
      <ResponsiveBar
        ...
        animate={false}
      />
    </div>
  );
}
Heading back to the browser gives us this console output.
It works! Only a couple of calls to getDollarAmount left.
Solving the mystery
We're really close to solving the mystery. Let's quickly recap.
- The problem is related to an asynchronous call to
setStatein ourBarChartcomponent - The code that is responsible for the calls is inside the nivo
Barcomponent, a third-party library - When we disable animation the problem seems to be solved
How does this all fit together? Let's have another close look at the source code of the nivo Bar component.
We can see that the element we were investigating before with our log statement in this line
return React.createElement(barComponent, {
is wrapped inside a component called TransitionMotion which accepts a render prop as children.
What is this component? When we have a look at the top of the file we can see where it's imported from.
import { TransitionMotion, spring } from 'react-motion'
An npm package called react-motion. If you don't know this library have a look.
The TransitionMotion component is responsible for the animation. It calls it's children repeatedly to update their position!
Now the hundreds of calls make sense! We're animating a couple of bars. If the position of every bar is updated 50 times or so during an animation, we can explain the number of calls. This is a realistic number.
Ok, that solves why there are just a couple of calls to getDollarAmount when the animation is disabled in the ResponsiveBar component.
But what about the first point of the list above? Why is this only happening when we set our state asynchronously?
Our initial data inside the state is an empty array.
function BarChart() {
  const [data, setData] = useState([]);
Thus there are no values to be rendered inside the bar. It's probably safe to assume that the default value for the Bar component is 0 in this case.
After the component did mount we fetch the data and update the state. This means that there is a certain period when the bar values are 0. The real data is set after the API responds.
Now it makes sense that we see an animation. The position of the bars has to be updated from 0 to their final values.
In contrast, when we set the mock data to the state immediately the bar values are already available at the first render of the Bar component. There's nothing to animate. Thus we only have a couple of calls to getDollarAmount.
Wrapping it up
I hope this example of how I debug a React app has been helpful to you. Here are some of the techniques that we saw.
- Analyzing the code
- Debugging re-rendering issues with log statements
- Debugging problems caused by API calls through mock data
- Investigating third-party source code
- Using breakpoints to find the origin of a function call
- Debugging third-party libraries inside
node_modules
Get a free cheatsheet with more debugging techniques
If you found this post useful click the above link and get a cheatsheet with lots of techniques for debugging React applications.







Top comments (1)
nice!