
Introduction
Debugging microservices can be hard. Are you going to run all those services at your own development machine, or do you mock your dependencies? Wouldn't it be nice to just debug and work on single service and use other services directly from your Azure Kubernetes Service (AKS) cluster? Luckily, Azure Dev Spaces enables you to do just that.
In this blog post I'm going to show how you can try it yourself. I'll show one demo application which I have been showing to my customers when I've wanted to explain how dev spaces works and how can you use it to improve your workflows.
I recommend that you first check the official documentation pages how to install Azure Dev Spaces on AKS and how to get client-side tooling installed to your local dev machine. With those instructions you should now have working AKS cluster with dev spaces enabled namespace that we can use in this example.
Before we jump into my demo application, I want to still go through this diagram:
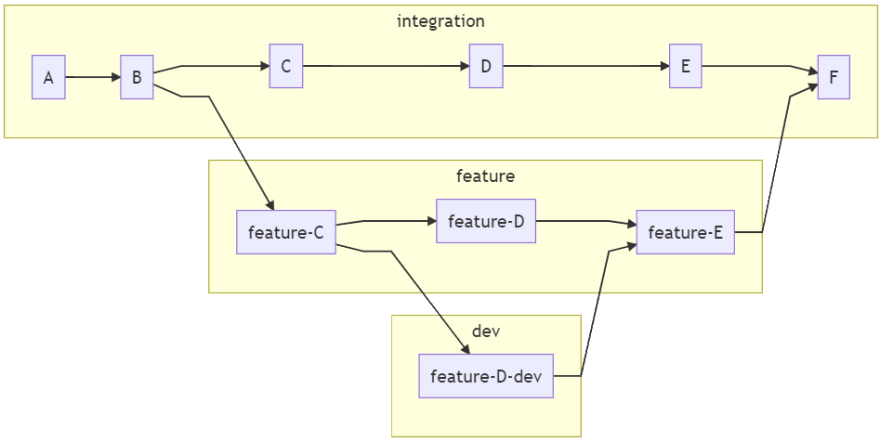
Above diagram tries to illustrate more complex scenario with dev spaces. You can use dev spaces to share different microservices between your team members.
In above example services A, B, C, D, E and F are baseline
versions of the services. In this example these are running in dev spaces
enabled namespace integration.
Those baseline services are then overridden in feature specific dev space
with services feature-C, feature-D and feature-E. These are running
in child dev space integration/feature.
Developer working in this feature has created another child dev space to
override one specific service with feature-D-dev and that is running
in child dev space integration/feature/dev. This means that developer working on this individual service can debug and iterate on the code much faster.
If you think that above would be helpful also in your development, then I recommend that you try it out.
Try this yourself
This example application is tiny-node-app and you can find it from GitHub:
 JanneMattila
/
tiny-node-app
JanneMattila
/
tiny-node-app
Demonstrates how you can debug your microservices apps running Azure Kubernetes Service using Azure Dev Spaces
It's simple application and it has 3 different services web, api and db:

web is frontend service which is exposed to internet and api and db are backend services and they are not exposed to internet. Call chain is simple and it goes directly as in above diagram: web makes http request to api service which then does next request to the db service. Information then flows back and web plots the data to the simple web view.
In order to deploy this to your own Dev Spaces enabled AKS you can run following commands. Note: This means that we now deploy our team shared integration namespace directly from our development machine but in real life you should use Azure DevOps or GitHub Actions to do that. Here are the steps:
git clone https://github.com/JanneMattila/tiny-node-app.git
cd tiny-node-app

# web
cd web
npm install
azds up --detach-after Listening

# db
cd ../db
npm install
azds up --detach-after Listening

# api
cd ../api
npm install
azds up --detach-after Listening
If you missed the url of the application (it was printed when web was started) then you can get it using azds:
azds list-uris
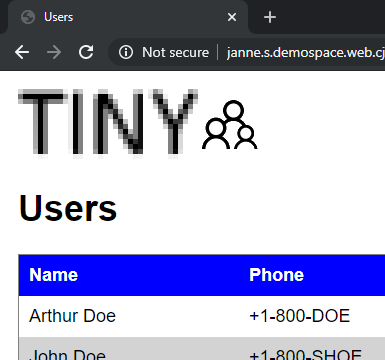
If you open that in your browser, you should see something like this:
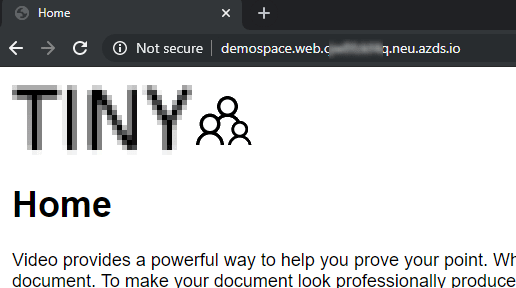
Notice that you can see your namespace and service name directly in the url (in my example demospace and actual exposed service web).
If you then click on that people icon next to the title you'll see this:
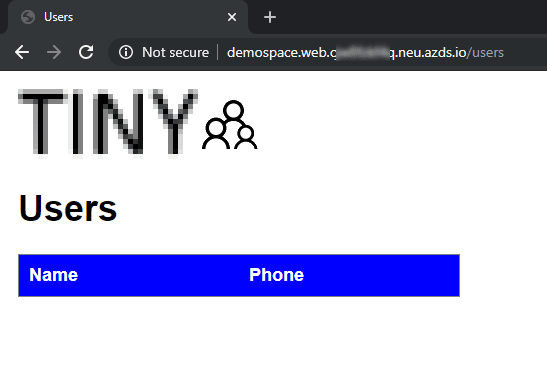
You can right away see that table does not contain data like it should.
So now it's time to take our debugging gloves and try dev spaces out!
Let's start debugging from our api layer because it's hidden behind the web layer and it tries to fetch data from the backend. We want to achieve this kind of debugging experience:

Without dev spaces you would have to think how to debug this since db is running inside the cluster and it's not available from your local development machine. Similarly, you would have to think that how would you flow exact same request to your api from the web service.
Let's start by opening our Visual Studio Code workspace in Visual Studio Code from our repo root:
code tiny-node-app.code-workspace
This should enable required extensions (such as Azure Dev Spaces).
Now we have the code available and now we need to ask dev spaces to do the magic for us. We start that by using Visual Studio Command palette:

Let's use the "Redirect an existing Kubernetes service to my machine".
Next we need to select service that we want to redirect to our development machine. Choose api as we want to debug that specific service:

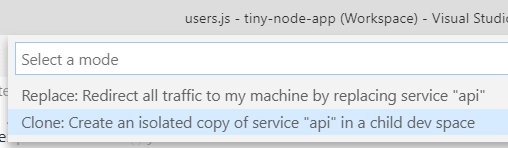
Next we need to select mode. In this case we want to debug our api service without impacting anybody else in our team so therefore we'll choose "Clone" as our mode:
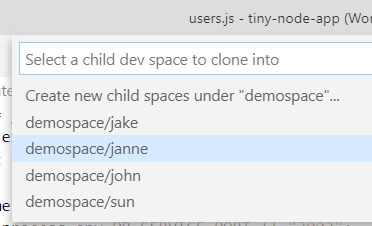
Since we chose clone it now asks which child dev space this clone should be now created (remember the diagram earlier in this blog post showing that you can use this to create multiple child dev spaces). In my demo I'll use my own developer specific namespace:
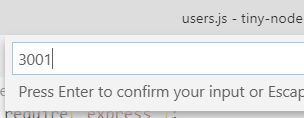
Next it will ask port to which the incoming traffic should be redirected:
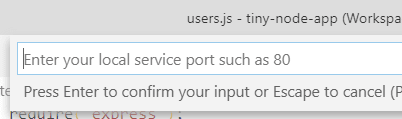
Choose 3001 to be our local service port (you'll see soon why):
After the selections dev spaces prepares the connections and then shows at the toolbar that it has successfully connected to that service:

Note: Dev spaces might request that you let it modify your hosts file so that it's able to connect back to the other services such as db in our demo scenario.
Here's small snipped from my hosts file (C:\Windows\System32\drivers\etc\hosts) after dev spaces has modified it:
# Added by Azure DevSpaces
127.1.1.8 kubernetes.default.svc.cluster.local
127.1.1.8 kubernetes.default
127.1.1.8 kubernetes
# ...
127.1.1.2 db.demospace.svc.cluster.local
127.1.1.2 db.demospace
127.1.1.2 db
When we configured dev spaces, we set that application will run in port 3001. That is the default port in api application when running locally. This means that you can just run your app normally (verify that you have correct profile selected at Visual Studio Code) and dev spaces will route incoming request to that port. When you click the debug button your application is started and it's ready to receive incoming calls:

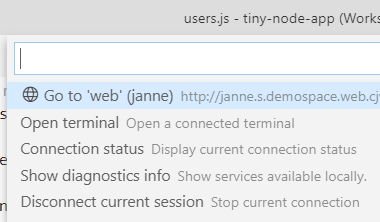
To find out our correct application url for that given child namespace, you can click on the "Dev spaces" toolbar:

It opens menu which allows you navigate to your own child namespace.
Now let's set breakpoint to our service. Open api\routes\users.js and set breakpoint to line 24. Now browse to the "people" view in your child dev space version of the app. You should now be paused in debugger in Visual Studio Code:
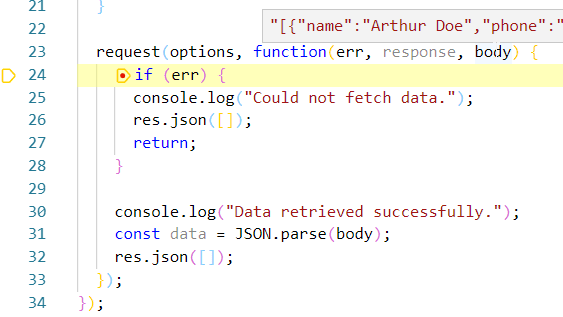
At this line we have already received data from our db backend which is still running inside the AKS cluster somewhere and not at our development machine! You can now freely debug and analyze the full http response from db and step through the different lines to see what's going on in our service. You can now see that the actual bug is at the line 32 which is clearly copy-paste from the above error scenario and it should really be res.json(data); instead. You can now change that line and restart debugging and see the correct output at the view:
Now when you have fixed the bug you can create pull request etc. to finalize the actual bug fix. After it gets merged it will be them automatically deployed via CI/CD to the shared integration dev space.
You can also try the shared namespace specific application while you're debugging your api service and you'll see that it's not impacted at all.
How does that routing work then? You can see all my source code in GitHub and analyze this further but one key part is the routing http header azds-route-as:

This routing header makes it possible to route the requests between different services running in dev spaces. Of course if you have other dependent services (e.g. Azure Service Bus) and you communicate via them then you need to take that into consideration when building these debugging capabilities.
I hope that I got you interested in trying out dev spaces. I really think it's big step forward. Not just in debugging front but also in pull request and code reviews when you can use dev spaces for testing out the changes implemented right away. I think really good example is code reviewing tons of HTML and CSS changes. It's so much easier to open the deployed app and side-by-side see code changes and the actual running application.
How to fail the demo (like I have done 😊)
This blog post would be too official if I wouldn't also mention how I have managed to fail my fancy dev spaces demos. So word of caution (note at the time of writing this blog post) you might get into trouble when showing this to people and you have zoomed in using Visual Studio Code because you won't find dev spaces command menu at the toolbar. I created issue about this to the dev spaces repository so hopefully in the future this won't happen.
VS Code extension and long text in toolbar causes dev spaces to disappear
#249

Dev spaces has quite long text in toolbar when connected:

Unfortunately this means that if you zoom even a bit in VS Code your dev spaces functionality disappears:

This means that you cannot access easily "Go to ..." functionality:

This is quite confusing for end user so maybe better option would be clip that in case it doesn't fit in long text mode (believe me I was confused when given demo and couldn't find the button I was looking for

Top comments (0)