The last time that I created a playground for experimenting with machine learning using Apache Spark and an InterSystems data platform, see Machine Learning with Spark and Caché, I installed and configured everything directly on my laptop: Caché, Python, Apache Spark, Java, some Hadoop libraries, to name a few. It required some effort, but eventually it worked. Paradise. But, I worried. Would I ever be able to reproduce all those steps? Maybe. Would it be possible for a random Windows or Java update to wreck the whole thing in an instant? Almost certainly.
Now, thanks to the increasingly widespread availability of containers and the increasingly usable Docker for Windows, I have my choice of pre-configured machine learning and data science environments . See, for example, Jupyter Docker Stacks and Zeppelin on Docker Hub. With InterSystems making the community edition of the IRIS Data Platform available via container (InterSystems IRIS now Available on the Docker Store), I have easy access to a data platform supporting both machine learning and analytics among a host of other features. By using containers, I do not need to worry about any automatic updates wrecking my playground. If my office floods and my laptop is destroyed, I can easily recreate the playground with a single text file, which I have of course placed in source control ;-)
In the following, I will share a Docker compose file that I used to create a container-based machine learning and data science playground. The playground involves two containers: one with a Zeppelin and Spark environment, the other with the InterSystems IRIS Data Platform community edition. Both use images available on Docker hub. I’ll then show how to configure the InterSystems Spark Connector to connect the two. I will end by loading some data into InterSystems IRIS and using Spark to do some data exploration, visualization, and some very basic machine learning . Of course, my example will barely scratch the surface of the capabilities of both Spark and InterSystems IRIS. However, I hope the article will be useful to help others get started doing more complex and useful work.
Note: I created and tested everything that follows on my Windows 10 laptop, using Docker for Windows. For information on configuring Docker for Windows for use with InterSystems IRIS please see the following. The second of the two articles also discusses the basics of using compose files to configure Docker containers.
Compose File for the Two-Container Playground
Hopefully, the comments in the following compose file do a reasonably adequate job of explaining the environment, but in case they do not, here are the highlights. The compose file defines:
- Two containers: One containing the InterSystems IRIS Community Edition and the other containing both the Zeppelin notebook environment and Apache Spark. Both containers are based on images pulled from the Docker store.
- A network for communication between the two containers. With this technique, we can use the container names as host names when setting up communication between the containers.
- Local directories mounted in each container. We can use these directories to make jar files available to the Spark environment and some data files available to the IRIS environment.
- A named volume for the durable %SYS feature needed by InterSystems IRIS. Named volumes are necessary for InterSystems IRIS when running in containers on Docker for Windows. For more about this see below for links to other community articles.
- Map some networking ports inside the containers to ports available outside the containers to provide easy access.
version: '3.2'
services:
  #container 1 with InterSystems IRIS
  iris:
    # iris community edition image to pull from docker store.
    image: store/intersystems/iris:2019.1.0.510.0-community

    container_name: iris-community

    ports:
    # 51773 is the superserver default port
    - "51773:51773"
    # 52773 is the webserver/management portal default port
    - "52773:52773"
    volumes:
    # Sets up a named volume durable_data that will keep the durable %SYS data
    - durable:/durable
    # Maps a /local directory into the container to allow for easily passing files and test scripts
    - ./local/samples:/samples/local
    environment:
    # Set the variable ISC_DATA_DIRECTORY to the durable_data volume that we defined above to use durable %SYS
    - ISC_DATA_DIRECTORY=/durable/irissys

    # Adds the IRIS container to the network defined below.
    networks:
      - mynet

  #container 2 with Zeppelin and Spark
  zeppelin:
    # zeppelin notebook with spark image to pull from docker store.
    image: apache/zeppelin:0.8.1

    container_name: spark-zeppelin

    #Ports for accessing Zeppelin environment
    ports:
    #Port for Zeppelin notebook
    - "8080:8080"
    #Port for Spark jobs page
    - "4040:4040"

    #Maps /local directories for saving notebooks and accessing jar files.
    volumes:
    - ./local/notebooks:/zeppelin/notebook
    - ./local/jars:/home/zeppelin/jars

    #Adds the Spark and Zeppelin container to the network defined below.
    networks:
    - mynet


   #Declares the named volume for the IRIS durable %SYS
volumes:
  durable:

  # Defines a network for communication between the two containers.
networks:
  mynet:
    ipam:
      config:
        - subnet: 172.179.0.0/16
Launching the Containers
Place the compose file in a directory on your system. Note that the directory name becomes the Docker project name. You will need to create sub-directories matching those mentioned in the compose file. So, my directory structure looks like this
iris_spark_zeppelin
local
jars
notebooks
samples
docker-compose.yml
To launch the containers, execute the following Docker command from inside your project directory:
C:\iris_spark_zeppelin>docker-compose up –d
Note that the –d flag causes the containers in detached mode. You will not see them logging any information to the command line.
You can inspect the log files for the containers using the docker logs command. For example, to see the log file for the iris-community container, execute the following:
C:\>docker logs iris-community
To inspect the status of the containers, execute the following command:
C:\>docker container ls
When the iris-community container is ready, you can access the IRIS Management Portal with this url:
http://localhost:52773/csp/sys/UtilHome.csp
Note: The first time you login to IRIS use the username/password: SuperUser/SYS. You will be re-directed to a password change page.
You can access the Zeppelin notebook with this url:
Copying Some Jar Files
In order to use the InterSystems Spark Connector, the Spark environment needs access to two jar files:
Currently, these jar files are with IRIS in the iris-community container. We need to copy them out into the locally mapped directory so that the spark-zeppelin container can access them.
To do this, we can use the Docker cp command to copy all the JDK 1.8 version files from inside the iris-community container into one of the local directories visible to the spark-zeppelin container. Open a CMD prompt in the project directory and execute the following command:
C:\iris_spark_zeppelin>docker cp iris-community:/usr/irissys/dev/java/lib/JDK18 local/jars
This will add a JDK18 directory containing the above jar files along with a few others to <project-directory>/local/jars.
Adding Some Data
No data, no machine learning. We can use the local directories mounted by the iris-community container to add some data to the data platform. I used the Iris data set (no relation to InterSystems IRIS Data Platform). The Iris data set contains data about flowers. It has long served as the “hello world” example for machine learning (Iris flower data set). You can download or pull an InterSystems class definition for generating the data, along with code for several related examples, from GitHub (Samples-Data-Mining). We are interested in only one file from this set: DataMining.IrisDataset.cls.
Copy DataMining.IrisDataset.cls into your <project-directory>/local/samples directory. Next, open a bash shell inside the iris-community container by executing the following from a command prompt on your local system:
C:\>docker exec –it iris-community bash
From the bash shell, launch an IRIS terminal session:
/# iris session iris
IRIS asks for a username/password. If this is the first time that you are logging into IRIS in this container, use SuperUser/SYS. You will then be asked to change the password. If you have logged in before, for example through the Management Portal, then you changed the password already. Use your updated password now.
Execute the following command to load the file into IRIS:
USER>Do $System.OBJ.Load(“/samples/local/IrisDataset.cls”,”ck”)
You should see output about the above class file compiling and loading successfully. Once this code is loaded, execute the following commands to generate the data for the Iris dataset
USER>Set status = ##class(DataMining.IrisDataset).load()
USER>Write status
The output from the second command should be 1. The database now contains data for 150 examples of Iris flowers.
Launching Zeppelin and Configuring Our Notebook
First, download the Zeppelin notebook note available here: https://github.com/denelson/DevCommunity. The name of the note is “Machine Learning Hello World”.
You can open the Zeppelin notebook in your web browser using the following url:
It looks something like this.

Click the “Import note” link and import “Machine Learning Hello World.json”.
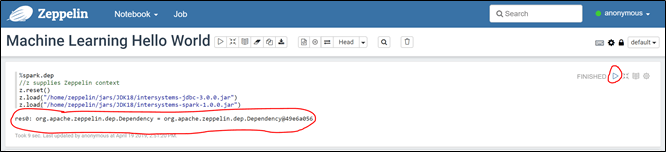
The first code paragraph contains code that will load the InterSystems JDBC driver and Spark Connector. By default, Zeppelin notebooks provide the z variable for accessing Zeppelin context. See Zeppelin Context in the Zeppelin documentation.
%spark.dep
//z supplies Zeppelin context
z.reset()
z.load("/home/zeppelin/jars/JDK18/intersystems-jdbc-3.0.0.jar")
z.load("/home/zeppelin/jars/JDK18/intersystems-spark-1.0.0.jar")
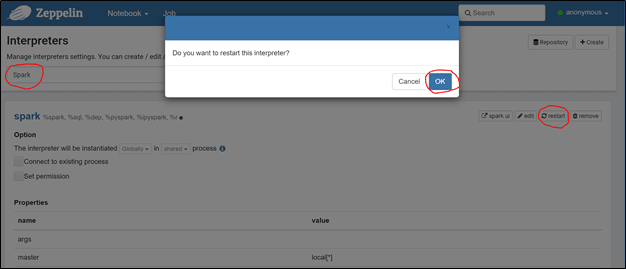
Before running the paragraph, click the down arrow next to the word “anonymous” and then select “Interpreter”.

On the Interpreters page, search for spark, then click the restart button on the right-hand-side and then ok on the ensuing pop-up.
Now return to the Machine Learning Hello World notebook and run the paragraph by clicking the little arrow all the way at the right. You should see output similar to that in the following screen capture:
Connecting to IRIS and Exploring the Data
Everything is all configured. Now we can connect code running in the spark-zeppelin container to InterSystems IRIS, running in our iris-community container, and begin exploring the data we added earlier. The following Python code connects to InterSystems IRIS and reads the table of data that we loaded in an earlier step (DataMining.IrisDataset) and then displays the first ten rows.
Here are a couple of notes about the following code:
- We need to supply a username and password to IRIS. Use the password that you provided in an earlier step when you logged into IRIS and were forced to change your password. I used SuperUser/SYS1
- “iris” in the spark.read.format(“iris”) snippet is an alias for the com.intersystems.spark class, the spark connector.
- The connection url, including “IRIS” at the start, specifies the location of the InterSystems IRIS default Spark master server
- The spark variable points to the Spark session supplied by the Zeppelin Spark interpreter.
%pyspark
uname = "SuperUser"
pwd = "SYS1"
#spark session available by default through spark variable.
#URL uses the name of the container, iris-community, as the host name.
iris = spark.read.format("iris").option("url","IRIS://iris-community:51773/USER").option("dbtable","DataMining.IrisDataset").option("user",uname).option("password",pwd).load()
iris.show(10)
Note: For more information on configuring the Spark connection to InterSystems IRIS, see Using the InterSystems Spark Connector in the InterSystems IRIS documentation. For more information on the spark session and other context variables provided by Zeppelin, see SparkContext, SQLContext, SparkSession, ZeppelinContext in the Zeppelin documentation.
Running the above paragraph results in the following output:

Each row represents an individual flower and records its petal length and width, its sepal length and width, and the Iris species it belongs to.
Here is some SQL-esque code for further exploration:
%pyspark
iris.groupBy("Species").count().show()
Running the paragraph produces the following output:

So there are three different Iris species represented in the data. The data represents each species equally.
Using Python’s matplotlib library, we can even draw some graphs. Here is code to plot Petal Length vs. Petal Width:
%pyspark
%matplotlib inline
import matplotlib.pyplot as plt
#Retrieve an array of row objects from the DataFrame
items = iris.collect()
petal_length = []
petal_width = []
for item in items:
    petal_length.append(item['PetalLength'])
    petal_width.append(item['PetalWidth'])
plt.scatter(petal_width,petal_length)
plt.xlabel("Petal Width")
plt.ylabel("Petal Length")
plt.show()
Running the paragraph creates the following scatter plot:

Even to the untrained eye, it looks like there is a pretty strong correlation between Petal Width and Petal Length. We should be able to reliably predict petal length based on petal width.
A Little Machine Learning
Note: I copied the following code from my earlier playground article, cited above.
In order to predict petal length based on petal width, we need a model of the relationship between the two. We can create such a model very easily using Spark. Here is some code that uses Spark's linear regression API to train a regression model. The code does the following:
- Creates a new Spark DataFrame containing the petal length and petal width columns. The petal width column represents the "features" and the petal length column represents the "labels". We use the features to predict the labels.
- Randomly divides the data into training (70%) and test (30%) sets.
- Uses the training dat to fit the linear regression model.
- Runs the test data through the model and then displays the petal length, petal width, features, and predictions.
%pyspark
from pyspark.ml.regression import LinearRegression
from pyspark.ml.feature import VectorAssembler
# Transform the "Features" column(s) into the correct vector format
df = iris.select('PetalLength','PetalWidth')
vectorAssembler = VectorAssembler(inputCols=["PetalWidth"],
                                  outputCol="features")
data=vectorAssembler.transform(df)
# Split the data into training and test sets.
trainingData,testData = data.randomSplit([0.7, 0.3], 0.0)
# Configure the model.
lr = LinearRegression().setFeaturesCol("features").setLabelCol("PetalLength").setMaxIter(10)
# Train the model using the training data.
lrm = lr.fit(trainingData)
# Run the test data through the model and display its predictions for PetalLength.
predictions = lrm.transform(testData)
predictions.show(10)
Running the paragraph results in the following output:
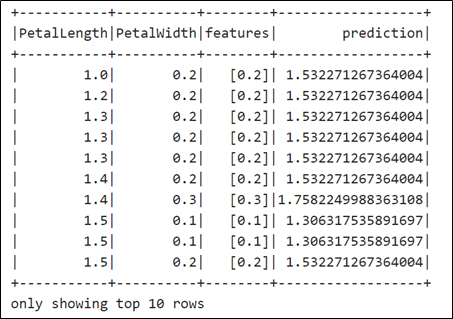
The Regression Line
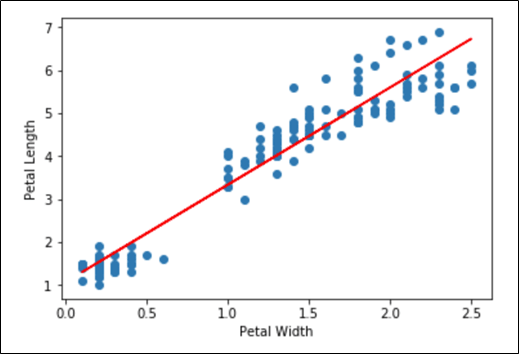
The “model” is really just a regression line through the data. It would be nice to have the slope and y-intercept of that line. It would also be nice to be able to visualize that line superimposed on our scatter plot. The following code retrieves the slope and y-intercept from the trained model and then uses them to add a regression line to the scatter plot of the petal length and width data.
%pyspark
%matplotlib inline
import matplotlib.pyplot as plt
# retrieve the slope and y-intercepts of the regression line from the model.
slope = lrm.coefficients[0]
intercept = lrm.intercept
print("slope of regression line: %s" % str(slope))
print("y-intercept of regression line: %s" % str(intercept))
items = iris.collect()
petal_length = []
petal_width = []
petal_features = []
for item in items:
    petal_length.append(item['PetalLength'])
    petal_width.append(item['PetalWidth'])
fig, ax = plt.subplots()
ax.scatter(petal_width,petal_length)
plt.xlabel("Petal Width")
plt.ylabel("Petal Length")
y = [slope*x+intercept for x in petal_width]
ax.plot(petal_width, y, color='red')
plt.show()
Running the paragraph results in the following output:
What’s Next?
There is much, much more we can do. Obviously, we can load much larger and much more interesting datasets into IRIS. See, for example the Kaggle datasets (https://www.kaggle.com/datasets) With a fully licensed IRIS we could configure sharding and see how Spark running through the InterSystems Spark Connector takes advantage of the parallelism sharding offers. Spark, of course, provides many more machine learning and data analysis algorithms. It supports several different languages, including Scala and R.


Top comments (0)