
This article is a continuation of the prior article on understanding APIs, requests, and responses and relies on concepts from that article.
This article is a step-by-step diagnostic guide for working through common issues with web services. The article assumes that you have a web client and a server and are trying to get the two of these to communicate but are having issues.
This article was written for Tech Elevator students and graduates who typically work with Java, C#, and JavaScript technologies, but the contents of this article are language agnostic.
Web Services and Complexity
Code is complicated and many things can go wrong. However, when you add web communications to the mix, a much larger amount of issues can occur beyond compiler and logic errors.
Some things that can go wrong include:
- Network issues prevent you from talking to the other server
- The other server might be down for maintenance
- New code on the server’s side may require you to change how you call their API
- Your request data may not be in a valid form the server can accept (for example, trying to book an appointment on a day that the business is closed)
- Users may not have filled out required pieces of data
- Your login information may be missing or may have expired requiring you to log in again
All of the issues above are things that can break an already working API, so as you can imagine, getting a new API working for the first time can be very hard.
However, if you follow a logical progression you can diagnose and resolve most web service issues.
Diagnosing API Issues
Here are four steps I’ve learned to follow when diagnosing issues:
- Get Information on the Request and Response
- Identify the Problem Area
- Divide and Conquer
- Debug and Resolve

We’ll look at each one of these in turn.
Step 1: Get Information on the Web Request
The first thing to look at when diagnosing web communication issues is to get information about the request being sent and the response coming back.
If you are making a simple GET request that doesn’t require authentication, you can typically do this in the browser with your browser’s developer tools open and the network tab selected. See Chrome’s official tutorial for more information about how to access this feature.

Chrome’s network tools (pictured above) allow you to select a specific request and get details on a number of things on the Headers tab, including:
- The Request URL
- The Request Method (or verb)
- The resulting Status Code
- Headers associated with the request and the response
- The Request Payload (or body)
The Preview and Response tabs will also provide more information about the returned data as pictured below:

Sometimes you need to diagnose non-GET requests or requests that require authentication tokens. In these cases I like to test from the wonderful (and free) Postman application.

With Postman, you can specify the method/verb you want to use, the URL to use, set any headers you need (such as an authentication bearer token), and provide a body to accompany your message (make sure you set the content to raw with an application JSON content type).
Once that’s done, clicking Send will make your request and display the results in the lower pane, allowing you to observe the status code, response body, and response headers.
Alternatively, if your application is making calls from code, you can use a debugger to get details on the request and response based on whatever library you are using to make web requests. However, be very careful if you are doing this because it is very easy for developers to assume details about the requests they are making that are incorrect. Postman removes this concern and allows you to verify the behavior of the web service independent of your client code.
See Postman’s wonderful learning center for more information on how to get started with that application.
Step 2: Identify the Problem Area
Now that you have information on the actual request and response that you are encountering, you can start to determine what’s going wrong.
In my experience, the most helpful thing to do is to determine where the error is occurring – if the client is sending a bad request or if the server is sending back a bad response. Once you can focus on one of the two areas, the problem becomes a lot less daunting.

As you’re looking over the information about the request and response it’s important to verify that the request looks correct.
Here are some of the things I commonly check:
- Is the request using the appropriate URL?
- Is it using the right method/verb? E.G. is it doing a GET when it should be doing a POST?
- If the request is a POST or a PUT, is it including a body?
- Does that body look correct? Even little things like sending a string “1” instead of a number 1 can make a difference.
If you are certain that the request looks correct in all aspects, look at the response. The response can tell you a lot about how the server handled your request. There are two very important pieces of information associated with the response: the response status and the response body.
Using the Response Status
The response status is a code ranging from 100 to 599. As a developer, the status codes you’re most likely to see are in the 200-299 range, the 400-499 range, and the 500-599 range.
Each of these major ranges of status codes represents something different. The 200 series of status codes is typically used for things going without issues. On the other hand, the 400 and 500 series status codes all indicate something went wrong or is invalid. 400 series status codes indicate that the server thinks there’s something wrong with the request whereas 500 series status codes typically indicate things going wrong with the server.
Although it can be intimidating, these status codes can quickly communicate what happened to you as a developer. Because of this, they are important to learn. Typically if the response status is not in the 200-299 range, something went wrong and you’ll need to diagnose it if it is not immediately apparent.
We’ll talk more about some of the individual status codes people see most as developers later on in step 4.
Using the Response Body
While the response status is a simple numerical code, the body of the response could be anything from completely empty to a simple error message to a complex JSON object. The contents of the response body depend on the server technology that you are working with (some of them will automatically generate responses for invalid requests, for example) and based on whatever response data your web service returns.
When you look at the response body, you want to check for two things:
- Does the response body tell me anything interesting? For example is an error message included in this response?
- Does the response body look correct? If it doesn’t, your server may have a bug. If it does, your API may be working correctly but you may have a bug working with the result of the API call.
If you suspect your server may not be returning the correct result based on the body you got back, it’s probably a good idea to put debugging breakpoints on your server and step through what happens when you send that request.
Step 3: Divide and Conquer
You should now have a reasonable idea of what message your client is sending to the server and what response the server is sending back.
At this point your primary goal is to divide the problem in half.
Because software systems are very complex, it can be helpful to rule things out and focus on the remaining factors. This principle is extremely helpful when it comes to working with web services.
You should now have enough information to answer the following questions:
- Is the client sending an appropriate message to the server?
- Is the server responding with a successful status code and useful response body?
If you answered no to the first question, your problem at least starts with the client-side code which is not sending a valid request.
If you answered no to the second question, your server is not correctly handling the request from the client either due to an issue with the request (either content or authentication) or due to an error or logic flaw on the server. See more details in step 4 for diagnosing what’s going on, but typically if the status code is in the 400s you investigate the client and if the status code is in the 500s you investigate the server.
In the case where the server is returning 200 status codes but invalid data, that typically indicates a logic problem on the server-side and you should investigate the server.
In the rare case where the client is sending an appropriate request and the server is replying with a good response but things still appear buggy in your application, you likely have a problem on the client-side in handling the response to your data and should look at that code.
Step 4: Debug and Resolve
At this point, you’ve focused on just the client or just the server. Congratulations, this makes your job significantly easier. Your job now is to confirm the problem through debugging and make an appropriate fix.
Unfortunately, given how many different problems there could be and how many different status codes there are in web services, this makes my job in writing about debugging difficult.
When things are hard, I like to use pictures, so let’s take a look at a flowchart I created. This flowchart starts at the orange rounded rectangle at the top of the diagram and flows from there based on decisions in diagrams. Have your status code handy and follow the chart below:
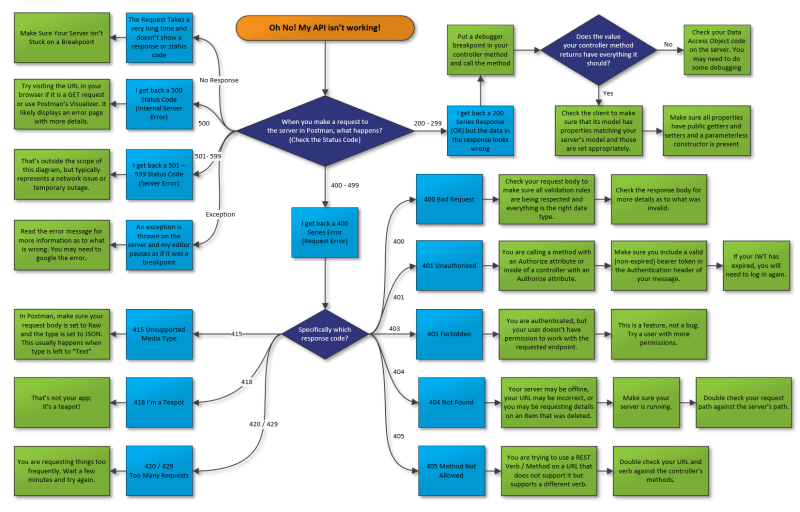
You may need to click on the image to expand it or right-click it and open it in a new tab for the best effect.
If you follow through this process, you’ll likely see a blue box containing the error you encountered and at least one green box recommending solutions or additional steps you can take.
I’ll outline some of the more common problems and the steps you take to address them in the section below, but if your error isn’t present here you may need to refer to Mozilla’s list of status codes or do some web searching.
Common Issues
Let’s take a look at some of the common status codes and what you can do about them.
No Response / Connection Refused
In the case where your server doesn’t return a response at all, you’ll usually get some form of “Could not connect to the server” message. This typically happens when your internet is out or your server is not running.
Another reason this can happen is if the server is paused on a breakpoint it may not handle subsequent requests.
Make sure you have a valid internet connection and your server is running and not stuck on a breakpoint..
200-299 Status Codes
If you get back a 200 series status code, it means the server thinks everything is fine. However, if you are debugging things and trying to figure out why something is working, that means that one of two things is going on:
- The server is returning a 200 series response but not doing the correct thing / returning the correct response body
- The server is returning a 200 series response and a correct body, but a bug still appears to the user
In case #1 you should debug the server and see how it goes about fulfilling the request because some form of a logic error is occurring where your program is not doing exactly what you expect it to do.
In case #2 you should debug the client’s code to handle the server’s response since it seems the API is functioning correctly. You may need to take a step back and think about how your application should work at a high level in order to spot the bug.
400 – Bad Request
A bad request is typically encountered when the client sends information that doesn’t match what the server is expecting. This could be anything from a missing piece of data to a value being in string form instead of a number to an invalid zip/postal code being sent over.
Typically when a server returns a 400 bad request, the response body will tell you more about what is invalid about the request. You can also take a look at the request body to make sure that the request looks valid and all parameters are present and in the appropriate type.
401 – Unauthorized
This error occurs when a client requests something that is secure but the server can’t verify who they are. Typically this happens when the client isn’t including an authentication token in its request headers, but it can also happen if an authentication token has expired.
Inspect your request and make sure you are sending the appropriate authorization header to the server.
If you are working with an external API, you may need to consult their documentation or contact them to discover how they want you to authenticate.
403 – Forbidden
If a 401 unauthorized occurs when a server doesn’t know who you are and requires login to get a specific resource, a 403 occurs when a server knows who you are but that identity isn’t allowed to access a specific resource.

Photo byTinus Marte onUnsplash
Think of it this way: Your server is a security guard standing in front of a very important doorway. A request walks up to the doorway, but the guard denies entrance. The request then says “Do you have any idea who I am?”. If the guard responds “No”, that’s a 401 unauthorized. If the guard replies “Yes, but you’re not allowed back here”, that’s a 403 forbidden.
403 forbidden responses are not bugs at all. These are instances where your application’s security is preventing unauthorized access to something. If you think you should have access to something, double-check your user’s permissions and the permissions the server enforces on the resource you requested.
404 – Not Found
This status code is the most commonly known one outside of development circles since it shows up in many browsers when a link is invalid or a URL is not typed correctly.
The 404 Not Found response code occurs in one of two ways in API development:
- You tried to call an API endpoint that isn’t present on the server
- You called a valid API endpoint requesting a specific thing that isn’t there anymore
The first case is the most common, so let’s talk about that. If I have a server that supports GET on a URL like /api/menu and you do a GET request for /api/menuitems , this is when a server is going to respond 404 telling you that there is no supported endpoint that handles a GET request to /api/menuitems. In this case, it’s best to compare the request’s URL to the URLs the server supports.
The second case occurs when you are trying to get something specific that is not present. For example, if I did a GET request to /api/products/5003 but the largest product number in the database was 250, the server wouldn’t be able to find the product I’m looking for and would justifiably return a 404 telling me that it wasn’t there.
In both cases, you should double-check your client’s logic and make sure that you are requesting an appropriate URL. Using the network tab in your browser is helpful for verifying that the requested URL is what you thought it was.
405 – Method Not Allowed
A 405 occurs when a server offers an endpoint that supports a specific method such as GET, but you try to access it using a different method. For example, if a server offered an /api/menu endpoint that supported a GET and I did a DELETE to that endpoint, I would get back a 405 method not allowed.
Typically a 405 occurs when you are using an incorrect URL for an operation or when the server has not yet implemented the method you’re trying to call. Double-check the API and make sure your URL is correct.
415 – Unsupported Media Type
This error is one that is most likely to occur inside of Postman. In Postman if you forget to change the content type of the request Body to JSON, you are likely to get a 415 response.

This is because the server doesn’t know how to handle the contents of your request. Make sure you set the content type appropriately in Postman.
If you are encountering this from code, you are likely either not specifying the content-type header of your request, or are setting it to something the server does not support. However, this is less frequently an issue so I will not go into it in more detail here.
420 / 429 – Too Many Requests
Some servers support rate limiting which is a way to throttle incoming requests and make sure that no one user overwhelms an API with too many requests in a specific time span.
Typically if you encounter a 420 or 429 response code it means you are calling the server too frequently and either need to decrease the number of requests you send or need to upgrade to a paid tier.
Consult your API’s documentation for more details.
Other 400 Series Status Codes
Sometimes you’ll get different responses from 400 – 499 that are not listed here. These tend to be more situational errors when working with unusual APIs. Refer to Mozilla’s documentation on the specific error code and consult the documentation of the API you are trying to work with. If the API is run by someone else, you may need to reach out to their support team.
500 – Internal Server Error
This typically happens when an exception is thrown in the server’s code while trying to handle the request. Take a look at the response body and see if it tells you where the error occurred. You can also put a debugger breakpoint on your server and step through until the error occurs.
Once you identify the offending line of code, make a change and test again.
Other 500 Series Status Codes
Sometimes you’ll get responses above 500. These typically refer to networking issues, servers being temporarily offline, etc. and are much harder to diagnose. Refer to Mozilla’s documentation on the specific error code and consult your network administrator as needed.
Step 5: Rinse and Repeat
Yes, I know, I claimed it was a 4 step process. It’s lied because when one problem is resolved, it may not be the end of your process.
After resolving a problem in web services, it is important to test again and go back to step 1 if a new problem is encountered.
Software is complex and many times there may be more than one problem preventing something from working. Sometimes you need to work through two or three problems in sequence before your application gets back into a working state.
Closing
As you can see, APIs are complex but powerful things. The learning curve is steep, but these technologies are critical to modern web development.
Understanding APIs and API debugging is a core skill for developers of all types which is why we put such an emphasis on it at Tech Elevator.
Beyond developers, technology professionals such as quality assurance professionals, project/product managers, system administrators, and technical leadership all need to have a firm understanding of the basics of APIs and the challenges they present to development teams and development projects.
In short, learning APIs is vital and something you need to do. Hopefully this guide helps you along your way.
The post How to Debug Web API Problems in 4 Steps appeared first on Kill All Defects.


Top comments (2)
Great post. I hope you do one on API versioning. This is an issue with strong opinions on many sides.
That's a good idea. I don't actually have strong opinions on that one, but it'd be an interesting topic.