Every good developer knows that in the process of software development, the ability to debug the application properly plays a vital role in the overall software delivery cycle, even for newer developers a lot is learned simply by debugging code. In the PHP language, functions like print_r, var_dump are a part of the language's inbuilt tool for debugging, enabling error logging also gives the developer valuable insights into potential issues with the code.
That brings us to Xdebug, a PHP extension that changes the entire development feature by enriching it with features like step debugging, improved error reporting, profiling, etc. We will do a step-by-step process for installing Xdebug and using it with Vscode.
Installing Xdebug for PHP
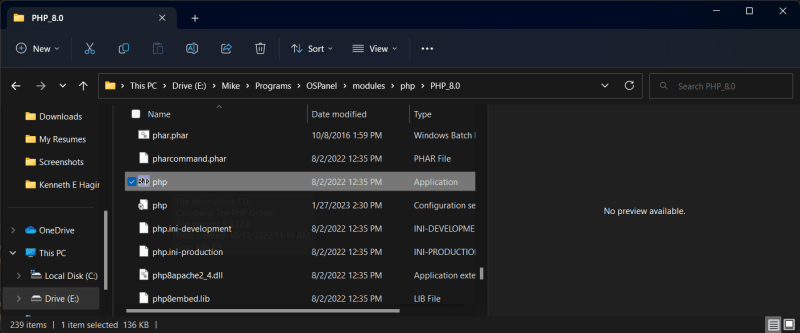
The first step is to determine the root location of the PHP you use for your local development, for me, I have multiple bundled web servers with several versions of PHP, so I had to be specific about the one I was working with to avoid confusion
Using their documentation
For Unix-like systems;
Xdebug can be easily installed using a package manager
Run:
pecl install xdebug
For Windows:
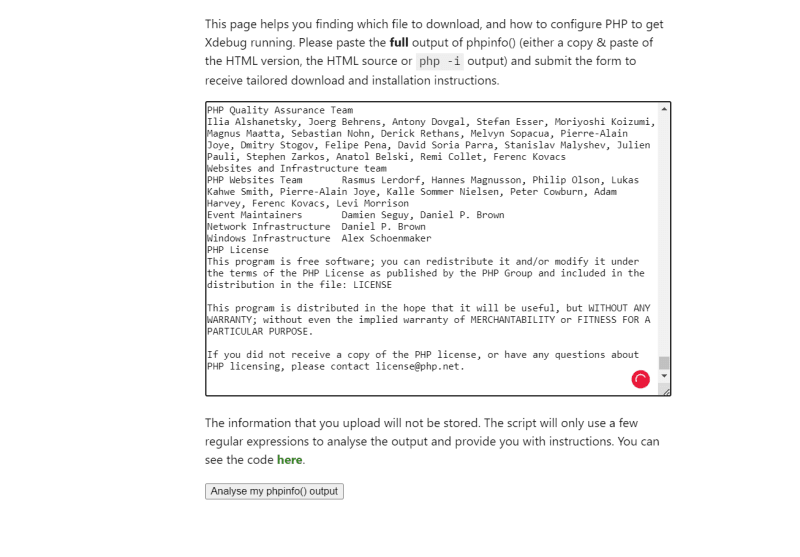
You will need to copy the output of phpinfo() or php -i into their installation wizard, this will give you the right version of Xdebug to install along with some instructions to install it

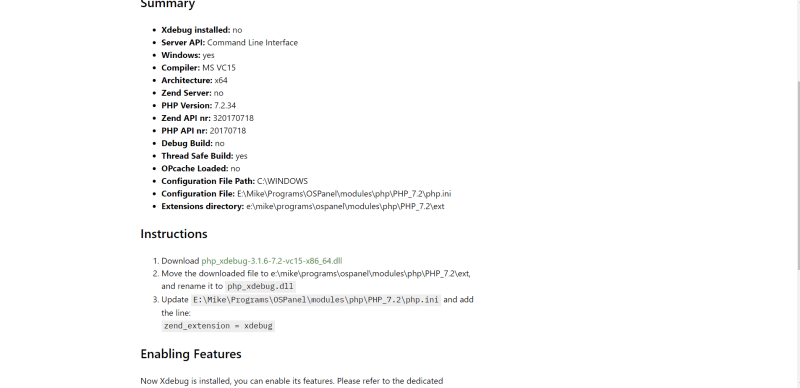
Carefully follow the above instructions about placing the php_debug.dll file in the ext folder
and edit the php.ini file to add this
zend_extension = xdebug
xdebug.mode = debug
Run the phpinfo() or php -i again to determine if the extension is operational
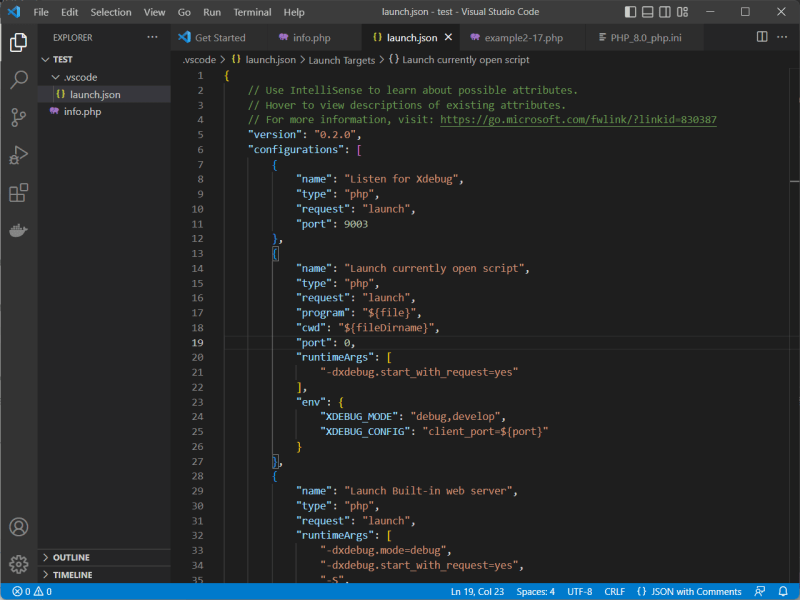
then we'll install the Xdebug based extension on Vscode called PHP Debug.
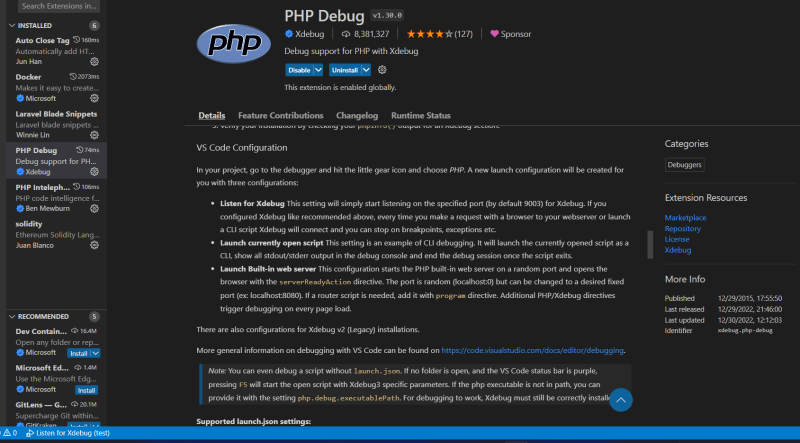
From the Debug tab add configuration and select the PHP environment, this will bring out a launch.json file in the root of the project directory
When you run the debugger you can add breakpoints to the code, these are the points where the code execution is paused and allows the functionalities of stepping over, in, and out of the code line by line. We also glean valuable insights into Stack traces, scope variables, superglobals, and user-defined constants as they are shown at each stage of the execution with the options to edit them, the debug console brings out all the output and relevant logs of the script.
Awesome, we will now see that with the proper debugging environment setup, the whole debugging experience is transformed from a dreaded and burdensome session to a more delightful one enhancing the much-needed productivity of the development process. Happy bug-hunting!


Top comments (0)