⚡ Tl;dr
- Standalone diagrams are great for quick and easy drawings to start discussing ideas with the most flexibility.
- Modelling allows you to scale many diagrams across teams by enforcing consistency and ensuring the objects in diagrams are up to date.
- Models can provide valuable insights about your software architecture, such as tech choices, service dependencies and deprecation status.
🚀 Let’s kick-off
Developing software has always been a team effort, and I’m sure most of us would agree that communication is one of your team's key skills to get things done. Most of us have probably experienced the pain of working in a team, where every person you talk to has a different perception of how the software works.
We commonly use aids such as diagrams and models to help everyone understand, discuss and agree on how the software looks today and how it might look in the future. This shared understanding is crucial for removing ambiguity and allowing your team to move forwards.
Let’s discuss how diagrams and models are used for talking about software.
🖼️ Start with diagrams
A diagram is a visual representation of your software architecture and usually only includes a small part of the overall picture. We’ve all seen diagrams that attempt to fit the entire architecture in one picture. Great diagrams aim to tell a specific story to a specific audience concisely. Research at 3M corporation discusses how our brains process visuals 60,000 times faster than text, making diagrams super effective for communication.
Standalone diagrams are great for easy drawing, so you can quickly get something down and start discussing ideas. The flexibility of these diagrams means you can easily invent new object styles and colour schemes to get across whatever point you’re trying to make without restrictions.
The limitations of diagrams become apparent when you scale them beyond a few team members. As objects in a diagram are not linked to objects in other diagrams, it becomes difficult to maintain once you have more than a few diagrams. Object styles and colour schemes are also difficult to keep consistent and increase the effort required for viewers attempting to understand a new colour palette every time they read a new diagram.
Let’s talk about how modelling can help.
📦 Scale diagrams with modelling
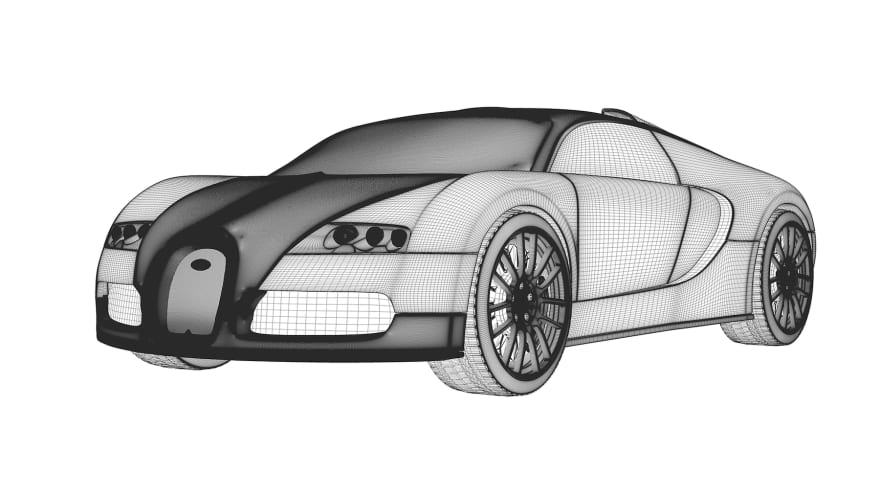
A model is a plan of something that includes details from various perspectives. The purpose of a model is to easily understand and iterate on the design without building the end result. It’s common practice to create models in building architecture and physical products, so why are we happy using only two-dimensional diagrams in software development?
Modelling tools allow you to create the structure of your software architecture, which can be visualized using diagrams. This is super powerful, as the diagrams automatically reflect changes when you update objects in the model. Some tools also apply constraints to object styles and colour schemes to enforce consistency of language across all diagrams. This helps resolve the common issue of outdated and inconsistent diagrams, which we hear are one of the biggest pains for teams.
A model can help scale your diagrams across many teams, creating a long-term, single source of truth that everyone can intuitively refer to, gain value from and keep up to date.
Most teams gain significant value just from visualizing their architecture, but modelling has other benefits, such as the ability to mine the model for insights.
⛏️ Mining your model for insights
The hierarchy and relationships defined in a model already include valuable details that teams can use. Some tools also allow extra metadata to be attached to these objects, such as technology choices, risk, cost or version numbers.
The ability to easily answer deeper questions about your software architecture can be valuable to your team and help you make better-informed decisions.
Examples of questions may ask:
- Which services are written in Python or NodeJS?
- Is a service dependent upon another deprecated service or connection?
- Are there any existing gRPC connections between these two services?
- If we remove a service, which other services will be impacted?
If you’re already mining your model, we’d love to hear experiences about the powerful insights you’ve uncovered from the model.
🖌️ Tools for diagramming
- Visio
- Diagrams.net (formerly Draw.io)
- Lucidchart
- Miro
🛠️ Tools for modelling
🏁 To wrap up
Most teams are already using diagramming tools to visualize and discuss ideas. However, fewer teams are taking advantage of a model, and even fewer are mining those models. Hopefully, this post has given you insight into where diagrams are best used and if modelling could be impactful for your team.
As with any new method or process, it’s easy to go crazy, so remember that just enough documentation is key to staying agile.
“Working software over comprehensive documentation.” - Agile manifesto.
Stay chill 🧊


Top comments (3)
I mostly use UMLet for diagramming, and this can be used for modeling as well. With some help of plain markdown documentation, we all set!
I use PlantUML for almost anything. I also recommend this collection.
I sometimes use an open source desktop diagramming tool dia for my starter or small design drawings. I also use it for annotating images in a user guide or documentation.