
...so just give me all your data and I will quickly use one of those boosting ensemble libraries like XGBoost or LightGBM or probably Catboost and then do some stacking and give you a very high performing model! That's how we roll! - hmmm, You Wish! 😆
If you really want to be a good great AI engineer, you need to first understand your data and build intuition about your data and this is where Exploratory Data Analysis (EDA) comes in!
The ability to dig into data and derive trends or patterns or relationships is a superpower! 😊. EDA helps you get a better understanding of your data, validate your hypothesis, derive insights and new features in order to get the best performing model.
We will go through an example of how EDA is performed using the Titanic Dataset -
So, from lines 1 to 11, some python packages are imported; and then some display options and styling are set up:
- For line 2 through 5, pandas and NumPy for data analysis and numerical computation respectively are imported. Also, we have Matplotlib and Seaborn for data visualization.
- Lines 7 and 8 help us see all columns and rows when using the head() method while Line 9 controls the width of the display in characters.
- Line 11 just customizes whatever plot we going to create. It sets the aesthetic style of our plots.
Then, from lines 14 - 20, the data is read in and the process of data exploration begins:
- Line 15 reads in the data while Line 16 gives the number of records(rows) and features(columns) in our dataset.
- Line 17 returns the top 10 rows in the data
- Lines 18 through 20 list the features, shows their data types and gives a concise summary of our dataset respectively.
Now, at this point, we really need to understand what each feature actually represents because it will determine the data type which informs how that feature is preprocessed - and feature preprocessing plays a role in deciding the model to be used in order to gain optimal performance. Also, understanding each feature helps feature generation. You see how all these ties in now right?
So, we have to do some research (in this case, get some domain knowledge about ship transport as regards the titanic) to know what each feature entails. Here, we explain some features and see that -
- PassengerId - is the unique id that identifies a passenger
- Survived - tells if the passenger survived or not. 0 is for deceased (No) while 1 is for survived (Yes)
- Pclass - is the passenger's class, which can be 1, 2 or 3
- SibSp - gives the number of siblings and spouse aboard
- Parch - tells the number of parents and children aboard
- Cabin - is the cabin number the passenger is in
- Embarked - gives the port of embarkation/boarding/departure which can be C (Cherbourg) or Q (Queenstown) or S (Southampton).
Let's dive into the top 10 rows produced by train_df.head(10) below -
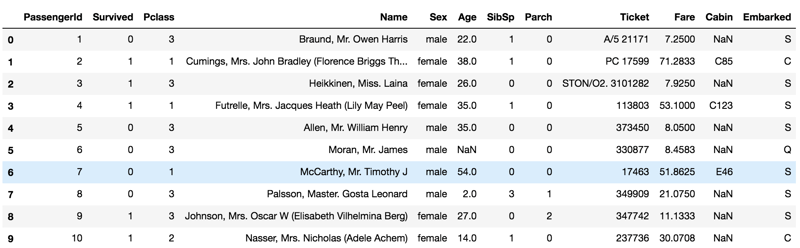
From above, we have mainly Categorical and Numerical features in our dataset - Categorical features, also called qualitative features, are features that can take a limited number of possible values. They can even take on numerical values but you cannot perform math operations on them because they have no meaning mathematically. But we have a kind of categorical feature that has meaning, which is called the ordinal feature. The categorical features in our titanic dataset are Survived, Name, Ticket, SibSp, Parch, Sex, Cabin, Embarked and Pclass -
- Survived and Sex are binary categorical features,
- Name is a categorical feature which has text values,
- Embarked, SibSp and Parch is a categorical feature with more than 2 values,
- Ticket is a categorical feature with a mix of numeric and alphanumeric. This feature value might actually mean something: from my little research, I think it can be used to find potential family members or nannies for each passenger - which can be a new feature generated perhaps,
- Cabin is a categorical feature that is alphanumeric,
- Although Pclass has a numeric datatype, it is actually is an ordered categorical feature i.e an ordinal feature which is ordered in a meaningful way - 1 is for 1st class; 2 is for 2nd class and 3 is for 3rd class. During your feature description research, you would know these have to do with the passenger's socio-economic status.
Numerical features, on the other hand, also referred to as quantitative features are features that have meaning in terms of measurement (continuous data) or it can be counted (discrete data). The numerical features are Fare (continuous), Age (continuous), and PassengerId (actually just an ID feature that identifies each passenger).
Now, let's take a look at the concise summary of the dataset produced by train_df.info() below:
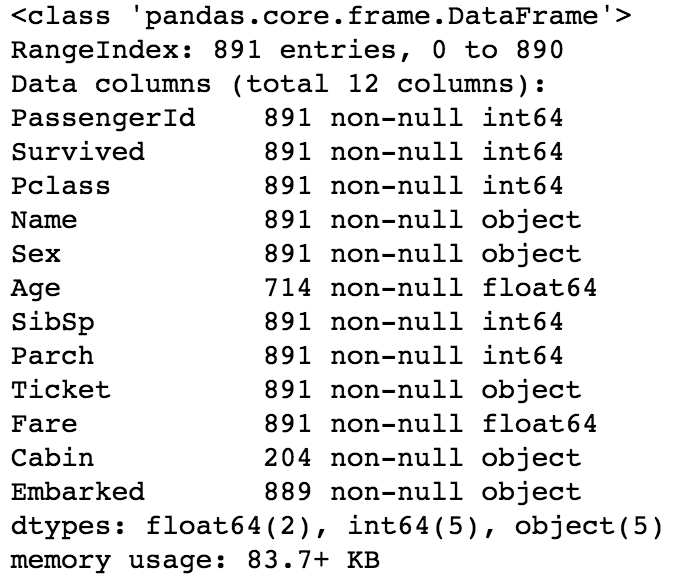
Looking at the summary of our dataset above, getting some kind of domain knowledge via research on the data would help us in a number of ways -
- to know if the feature has the correct data type, which when rightly converted helps in feature generation and also help in saving memory. For example, from above, the output tells us that all categorical types are stored as object data types. So, converting some of these to categorical data types would help in saving up some more memory.
- to understand why there are missing values - from above, Age, Cabin and Embarked features have 714, 214, and 889 entries, which is not up to the expected 891 non-null entries - 🤔 so, we can try to find out why this is the case - Yeah! have a curious mindset
- to know if the values of a feature are intuitive and actually contain the expected values. For example, we all know at least in these times (unlike in the days of old), that humans hardly live up to 200 years. So, when we do further data exploration in part B of this article series and see a passenger aged above 200 - it is one of 2 things - either it is an error or perhaps the titanic had some vampires or aliens onboard! 😂 - do not overrule any fact - anything is possible, so do your research and be sure!
So, this is just a tiny little bit of the process involved when you are starting out the exploration of your datasets! Stay tuned for the next parts on this topic, on this same series, where we look at what statisticians call the Five-number summary, then we will start ** analyzing each individual feature** and then go ahead to understand feature relationships and more in order to squeeze out all the insights from our data! Now, you make sure you have an amazing week ahead! 😉


Top comments (2)
Nice one ma'am, very detailed as always...
Thanks @cynchizy 😄