
Engineering success inevitably translates into product success. But how can engineering success be measured? How do teams introspect on the project progress, and find ways to steer through deadlines with software quality intact. The answer is Engineering KPIs. Most managers track engineering KPIs within specific, contextual framework like the SPACE research. But the model is not omnipresent, and most teams want to evolve further, and have personalized goals, and trackers in place.
Using specific measurement frameworks becomes crucial with constantly evolving engineering teams’ work processes- effort alignment, improve work processes, and maximize efficiency. But, why spend so much time tracking some metrics? Today, we will cover the importance of engineering KPIs and which 10 KPIs you should look for.
Why are Engineering KPIs Important?
KPIs or key performance indicators are used to measure engineering success, work progress, and ensuring all key parts of an engineering project is moving. For instance, if a team's goal is to improve communication, then KPIs could be the number of meetings held to solve blockers, code review score, and PR merge time. Engineering KPIs assist managers to:
Track Goals: KPIs allow engineering managers to set specific metrics for project goals. This keeps the teams focused and eliminates deviation. The manager can decide 3-4 KPIs for each goal and then quarterly or monthly track these for improved work progress visibility.
Align Effort: With KPIs, teams can work in a set direction and aim at goal-oriented metrics. With pre-decided KPIs, teams can track their work progress in a specific quantifiable manner. For instance, when you track the code churn rate, the team can save time and efforts on unproductive and experimental codes.
Allocate Resources: KPIs are goal-oriented metrics that enable engineering managers to identify blockers and wastages. That's how team leaders can identify grey areas and optimize resource allocation.
Improve Consumer Experience: KPIs allow managers to track specific metrics that prioritize the organizational goal. This leads to better product quality, and better team cohesion. It results in better customer experience and satisfaction.
Increase Efficiency: KPIs identify the blockers in the engineers' workflow be it burnout, increased code churn, or increased cycle time. The managers can analyze and fix these issues timely with KPIs.
Optimize Workflows: KPIs allow the managers to identify bottlenecks in the work processes. So, whenever the devs are struggling, it is easy to point out the right cause. As a result, the managers can optimize the workflows to fix these bottlenecks and boost productivity.
The managers should take data-driven decisions to achieve organizational goals with optimum resource utilization. KPIs allow you to use definitive measures to base decisions and improve workflows, instead of resorting to ambiguous tactics. Engineering KPIs fill you with the relevant information for finding gaps to make informed data-driven decisions. Now that we discussed why KPIs are important, let us see what all KPIs an engineering leader, manager, or team head should track.
Top 10 KPIs For Engineering Manager To Get Insights Into Dev Workflow

Data-driven decisions are not about looking at some data available and making decisions henceforth. Smart managers align KPIs with the team and organization goals and track them to improve existing workflows. This increases the scope of improvement and helps to achieve the organizational goals, instead of just daily tasks or individual goals. Here are ten KPIs that engineering leaders shall add to their analytics software.
1. Cycle Time
Cycle time measures the time taken by an engineering team to create and deploy a code. It enables managers to analyze the speed and performance of engineering teams. A low cycle time can create healthy engineering teams and boost innovation. A high cycle time can lead to poor dev satisfaction and an inability to achieve goals.

Optimizing the cycle time requires work data and insights about engineering teams. Hatica helps managers to track cycle time to identify bottlenecks and accelerate product delivery. They can easily track the time from the start to the code deployment.
2. Effort Allocation
Effort allocation is a development strategy where the managers look into how much time to allow for new development vs quality improvement. Devs continuously working on projects needs to find a balance between new features and improving current products. Teams can alternate cycles of adding functionalities and improving existing systems.
3. New Engineering Hire Ramp Time
This metric analyzes how much time a new hire takes to familiarize themself with the running projects. The managers should aim to reduce new-hire ramp time to boost efficiency and productivity. This can be tracked by looking into pull requests by new engineers. The team should be supportive during the code reviews. Overall, the manager should optimize the onboarding process to reduce new-hire ramp time.
4. Dora Metrics

Dora metrics involve:
Deployment frequency: measures the number of deployed codes. This can range from multiple deployments in a day to once per month or 6 months.
Change failure rate: indicates the percentage of low-quality codes deployed that further require improvements. This can range between 0-60% depending upon the team's performance.
Mean time to restore or MTTR: time to restore the product or service post any defect. It ranges from 1 hour to 1 week or month as well.
Cycle time: to track time period from writing code to final deployment.
Engineering teams should aim to optimize the metrics for faster product delivery and customer satisfaction.
5. Dev Throughput
Dev throughput includes the number of features or tasks a team ships to production. One way of tracking dev throughput is through:
Code churn: measures the code rewritten or deleted within 21 days of merging.
Productive throughput: measures the code that didn't churn within 21 days.
Efficiency: percentage of code that didn't need any rewriting or deletion.
All these combined looks at how many codes were ineffective and lead to wastage.
6. Dev Maker Time
Maker time is the focus time where an engineer works without any distractions such as meetings, etc. It aims at reflecting the time distribution of an engineer's day. High maker time ensures devs are working on what they love most- code without having to run for meetings and interviews. High maker time is proportional to high developer productivity in an organization.
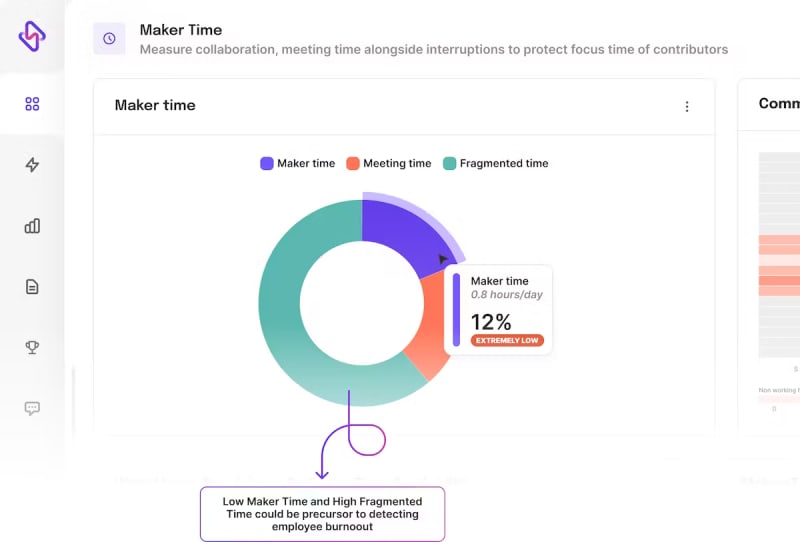
The manager should keep maker time of at least 120 minutes in one slot to ensure devs are unhindered by any external disturbance.
7. Bugs Filed and Resolved
Bugs are the number of faults or errors in code or product delivered. It is advisable to document each bug for future reference and quickly fix it in case of recurring errors.
8. Uptime
Uptime refers to the duration where the product runs efficiently. It is crucial to maximizing uptime for customer satisfaction. In case of prolonged downtime, the customer might switch or create a negative brand image. Engineering managers should figure out bottlenecks and optimize the number of tickets to enhance the uptime.
9. Sprint Burndown & Release Burndown
Sprint and release burndown indicate the work progress and the amount of work left along with ideal work progress. Release burndown shows the team progress within all the sprints, while the sprint burndown highlights only the current sprints.
It works well for teams with consistent sprint duration as it is easier to collect and analyze data. This helps in work progress visibility and effort alignment.
10. Developer Well-Being
Tracking developer well-being is critical for a healthier work environment and manage dev burnout. Only when devs are fully plugged into a project, they can deliver work success. However, often due to poor visibility, managers cannot figure out their dev's work patterns, and cannot do much to preempt signs of stress or burnout in developers.
Data-driven Decision Making Is Now Easier With Hatica
Tracking KPIs is crucial for engineering success and customer satisfaction. And it does not end with measuring specific metrics and working on the indicators in isolation. What is more important is connecting them to a specific goal and evaluating the gaps and blockers for enhancement.

Hatica is the ultimate solution to tie metrics with goals and track KPIs for maximum efficiency. Hatica equips engineering teams with granular visibility into cycle time, maker time, dev throughput with 130+ other metrics for teams to reduce bottlenecks, have an accelerated delivery and achieve a better developer experience. Learn how Hatica can help you build better engineering teams. Request a demo→

Top comments (1)
Thank you for sharing this information.