Post-Mortem: LinkedIn Talent Intelligence Experience
This project post-mortem covers a unique use of Craft CMS 3, GraphQL, and VueJS to create an interactive experience for LinkedIn’s Talent Intelligence Experience
Andrew Welch / nystudio107
I was recently tasked to do an unusual project as part of the LinkedIn Talent Intelligence Experience. Taking place in New York City, then Paris, and then Sydney, the live events highlighted LinkedIn’s new Talent Intelligence platform which targets enterprise customers.
These series of events were spearheaded by Unit9 and produced by dandelion + burdock, and encompassed a huge undertaking that involved multiple rooms with interactive video, strategy sessions, presentations, cocktails, and much more. I’m just going to focus here on the small part of the project that I worked on, because I think it’s an interesting use of technologies to pull off an interactive experience.
I worked on the project under the direction of Niall Thompson from dandelion + burdock, and with my long-time partner in crime, Jonathan Melville from CodeMDD.io to do the design and frontend template coding. I was tasked with the planning, architecture, devops, and core app design, so that’s what I’ll focus on here.
What I hope you’ll take away from this post-mortem is starting to think about how you can leverage web technologies and your skillset in non-traditional ways.
The Problem
The client wanted an experience where people could interact with an app on multiple tablets mounted on plinths in front of a large projection wall. People approaching the tablets were given information on a fictional company that wanted to relocate to another city, and it would be the their responsibility to pick where to relocate.
They’d be presented with a number of questions on available talent in a variety of cities. They’d then be encouraged to explore the presented multiple-choice answers, and see insights from their choices displayed on a large projection wall in front of them.
Then after gaining knowledge by interacting with the app, they made a choice about where to relocate the fictional company. There was no right or wrong answer to anything. The point was to be able to see the type of insights that LinkedIn’s Talent Intelligence could offer them.
In addition to this, the app needed to be able to:
- Work with an arbitrary number of tablet/projection screen pairings (“stations”)
- Work with an arbitrary number of cities that the event would travel to
- Handle having a different look, different questions, and different insights for each city
- When an answer was chosen on the tablet, dynamically change the “insight” shown on the projection screen
- Have a way to allow both the client and our team to collaboratively edit the questions, insights, etc. on the backend
- Record each unique user session of answers in the database as entries
- Present them with a final “insights” screen that showed how their answer compared to everyone else’s from that city’s event
- Capture their name and email address at the end, so LinkedIn could follow up
- Export all of the captured data so that the LinkedIn data team could analyze it
In addition, we wanted to design it so that if the client ended up wanting to turn it into a website, it wouldn’t be a complete rewrite.
The Result
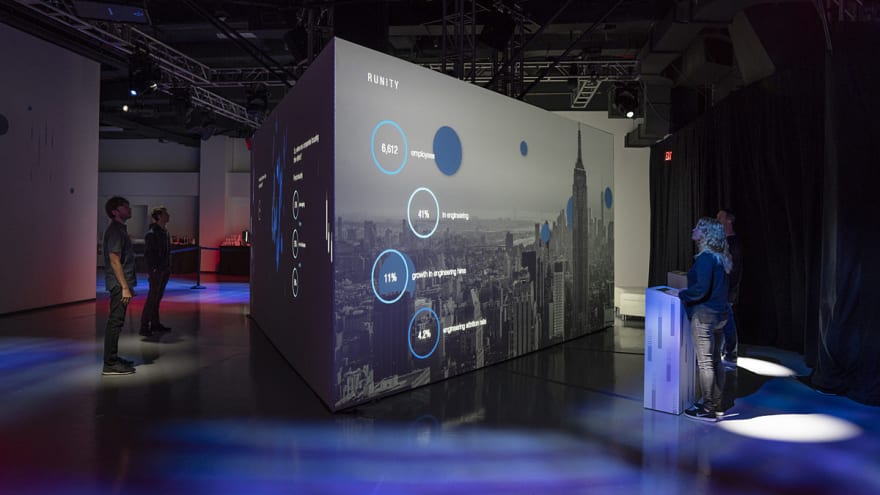
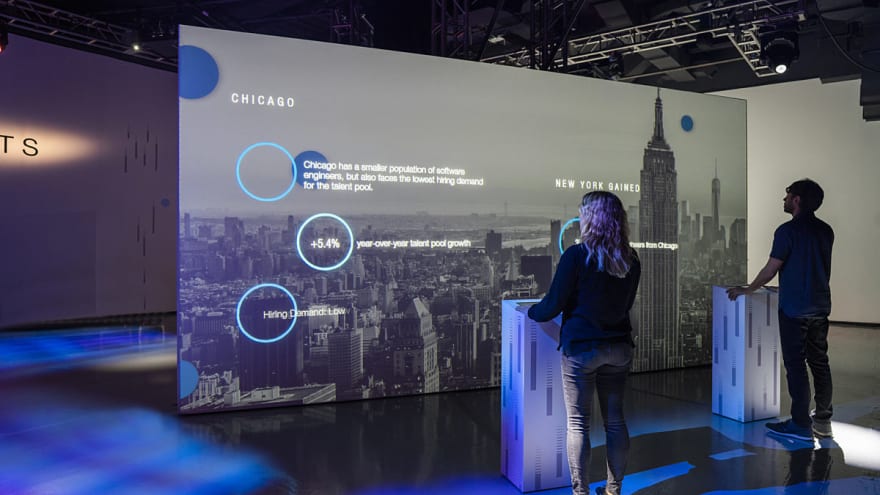
Before we get into the nitty gritty of how we approached the project, let’s have a look at the final result. Then we can deconstruct how we got from here to there.
It all came together in a way that blended with the branding and theme of the rest of the event. Here’s a YouTube video of it in action, if you want to see it all in motion.
The Solution
We didn’t have long to bring it all together… and the scope was in flux right down to the wire.
Because of how quickly everything had to come together, and how flexible it all needed to be facing the changing spec, we opted to put together some existing technologies to get off the ground quickly.
- Craft CMS 3 for the backend, because we knew it well, and we needed a way to allow a variety of content authors to work together. We also needed a place to record and export the data, so it was a natural fit.
- Tailwind CSS to style the web pages, because it allowed us to prototype and iterate quickly as the project morphed
- VueJS to do the app “guts” because again, it allowed us to prototype something quickly, and the reactivity was just a natural for the type of app we were making
- GraphQL via the CraftQL plugin from Mark Huot to handle reading/writing data from Craft CMS because it’s just so easy to use, and the data gets packaged up in a very natural way for VueJS
We’ve talked about every single one of these technologies on the devMode.fm podcast, so perhaps it’s not surprising that we chose them. But it’s interesting that these “web” technologies worked so well together for a live interactive app.
The Hardware
To make this all happen, we needed hardware to run it all on. Here’s a rough diagram of what that looked like:
We opted to go for a cloud server provisioned via Forge to host Craft CMS, so that the entire team could collaborate from their disparate locations.
However, for any live event, it’s not a great idea to depend on an Internet connection being stable enough to handle the job, or even be working. And indeed, we ended up losing Internet access on the second day of the New York City event.
We chose to use a small Meerkat server provisioned with the same Ubuntu 16.04 Linux that was running on our cloud server. It then synced the data down from the cloud server using the technique described in the Database & Asset Syncing Between Environments in Craft CMS article.
We then had the wizards at dandelion + burdock hook the Surface Pro tablets and Meerkat up to the local private network, and away we went.
The Surface Pro tablets were configured as discussed in the Chrome Kiosk Mode article, so that they could be running a modern browser like Google Chrome, but couldn’t be tampered with by any of the users.
The Software
On the software side of things, the center of the universe is Craft CMS 3. That’s where the data to display comes from, and that’s where any resulting answers from the user are stored:
We had two separate Twig templates for the tablet and display (projection wall) that have the HTML/VueJS code for each. That way we could fix the tablets to load /tablet and using Touch Designer, have it load the web view for /display to be composited on top of live video.
Because we needed to be able to handle multiple cities, and multiple stations for each city, we passed in the stationSlug URL parameter to indicate which station the web page should load. e.g.: /tablet?stationSlug=new-york-green would load the tablet view for the New York Green station.
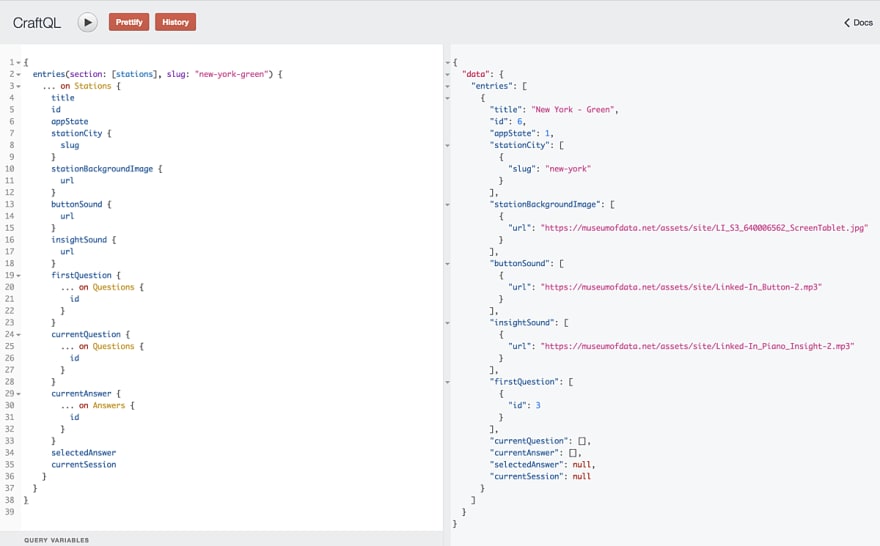
The custom VueJS app would then load the appropriate Craft CMS 3 entry via GraphQL/CraftQL in the Stations channel that corresponded to the given stationSlug.
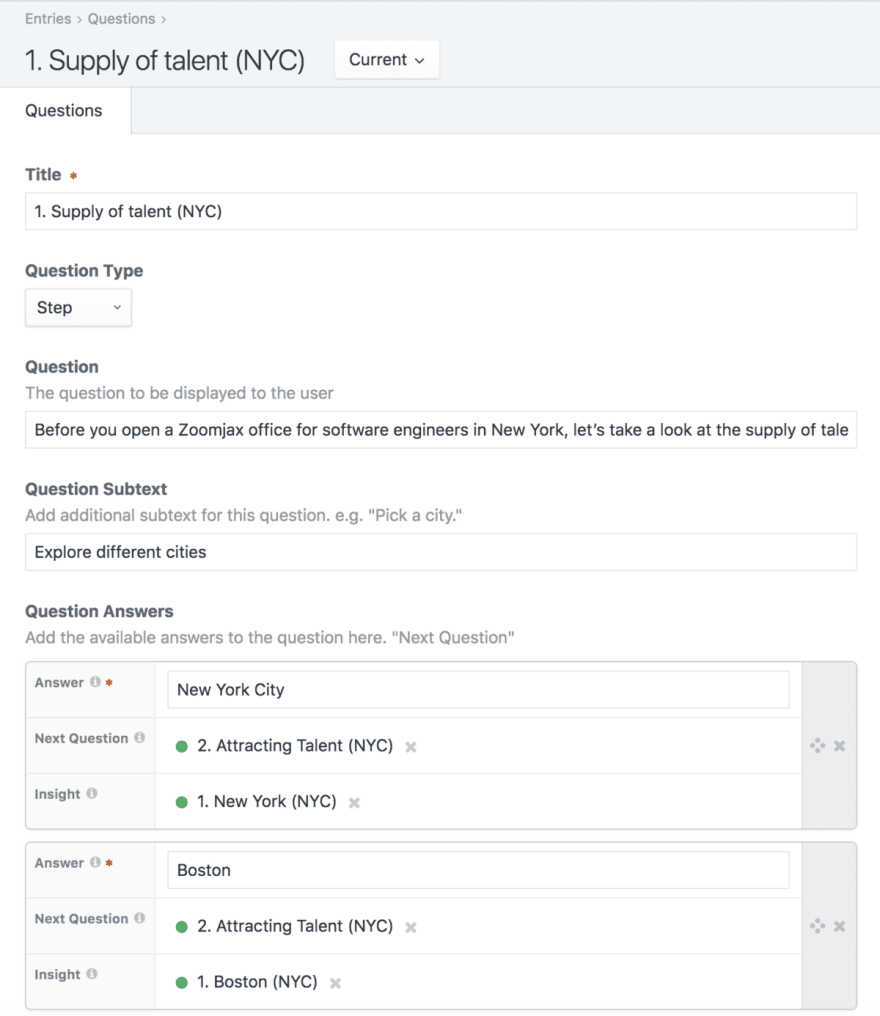
On the backend in Craft CMS, the entries looked something like this:
This is where content authors could choose the first question to ask, set the background image, choose the sounds to be played as auditory clues (via howler.js), and so on.
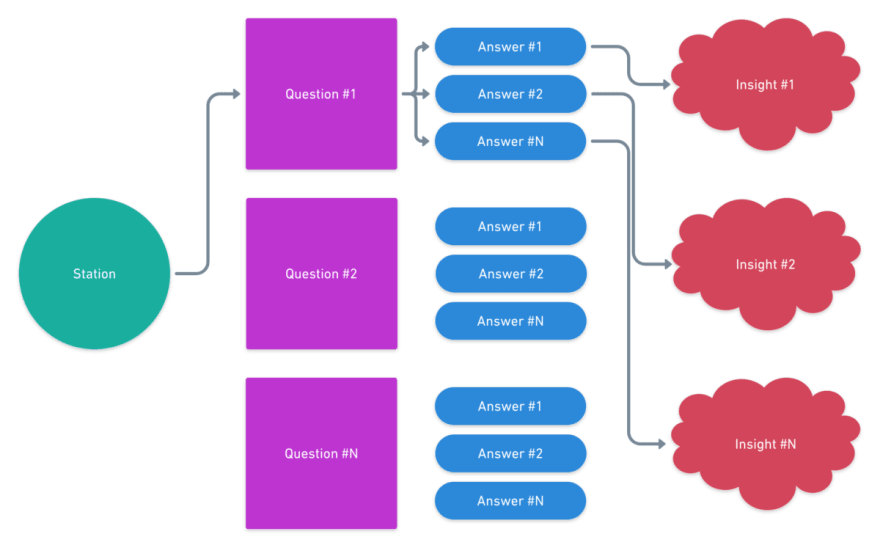
Originally the system was designed to be a “choose your own adventure” book style of questions, where the answer to one question could lead to a different question. That’s why the Stations entry only has you set the first question.
The db schema is pretty simple, and looks roughly like this:
…and each answer could link to the next question (if any).
In addition to providing a way for the content authors to customize things, this Stations entry then also kept the persistent state of the app. The tablet allows people to change the state by changing the entry with a GraphQL mutation, and the projection wall polls the state by doing a GraphQL query. I’d have preferred to do GraphQL Subscriptions, but that isn’t a thing yet in CraftQL.
Want to add an additional station? No problem, just add a new entry. Want to add a new city? No problem as well, just change the category the station is linked to.
This ended up being a good way to go, because the number of stations planned for use changed several times as the project progressed. And potentially, each city might have had a varying number of stations as well, depending on the event space.
This allowed great flexibility (maybe a bit more flexibility than was needed in the end). The questions were in a separate channel, with the SuperTable plugin used to provide a nice UX for adding an arbitrary number of answers:
For the data export, we used Fred Carlsen’s Beam plugin along with a custom template to allow easy export to a CSV file, on a per-city basis. This gives them access to each unique user session, with all of the answers they chose, as well as all of the lead capture information. All wrapped up in a neat little CSV bow.
Show me the App!
The custom VueJS app itself is mostly responsible for keeping track of state, and responding to various queries and input from the user. Here’s an example of what the stationsQuery GraphQL query looks like to retrieve the current state of a given station:
It’s really awesome how easily the CraftQL plugin lets you read (query) as well as write (mutate) data in Craft CMS 3. We ended up using GraphQL-Request to make the GraphQL requests easy. All we had to do was set up a client with a JSON Web Token (JWT):
const client = new GraphQLClient('/api', {
    headers: {
        Authorization: 'Bearer XXXXXXXXXXXXXXXXXXXXXXXXXXXXX',
    },
});
Then we can declare a simple GraphQL query like so:
const settingsQuery = `
    {
      globals {
        settings {
          recordAnswers
        }
      }
    }
    `;
In this case, all the query does is ask for the state of the recordAnswers lightswitch in the Settings Globals. We then can execute it like this:
// Load in our global settings
            loadSettings: function() {
                client.request(settingsQuery)
                    .then(data => {
                        this.recordAnswers = data.globals.settings.recordAnswers;
                        console.log(data);
                    })
                    .catch(err => {
                        console.log(err);
                        console.log(err.response.errors);
                        console.log(err.response.data);
                    });
            },
To do something like writing out the captured lead information at the end of a session, we simply have a GraphQL mutation like this:
const writeLeadMutation = `
    mutation writeLead($firstName: String!, $lastName: String!, $email: String!, $cityIdentifier: String!, $stationIdentifier: String!, $userIdentifier: String!)
    {
        upsertLeads(
            authorId: 1
            title: "lead"
            firstName: $firstName
            lastName: $lastName
            email: $email
            cityIdentifier: $cityIdentifier
            stationIdentifier: $stationIdentifier
            userIdentifier: $userIdentifier
        ) {
        id
        }
    }
    `;
In this case the channel in Craft CMS is Leads, with upsert being CraftQL nomenclature for “write”. Then each key/value pair such as title, firstName, etc. all just correspond to fields in the Leads channel that we want to save data to.
Due to VueJS’s reactive nature, as soon as we changed the properties in our app, the changes were instantly reflected to the user. This made for a really nice interactive experience for people using the tablets.
We also made good use of VueJS niceties such as computed properties, watchers, transitions, and the like… but that’s a story for another day.
Wrapping up!
The custom VueJS app is only 864 lines of code, so it’s nothing terribly complicated. But getting all the various pieces that run asynchronously to work in harmony took a bit of doing.
There also was quite a bit more work that went into the project as a whole in terms of the actual templates, the CSS, etc. But a large chunk of the work was simply figuring out all of the various pieces we’d need (both hardware and software), and bringing them all together.
I was one very small part of a huge production, but I had a lot of fun trying to apply web technologies to a live interactive event. Hopefully this might get you thinking about some non-traditional applications of web technologies!
If you missed it the first time around, check out the YouTube video showing the project in action!
Further Reading
If you want to be notified about new articles, follow nystudio107 on Twitter.
Copyright ©2020 nystudio107. Designed by nystudio107








Top comments (0)