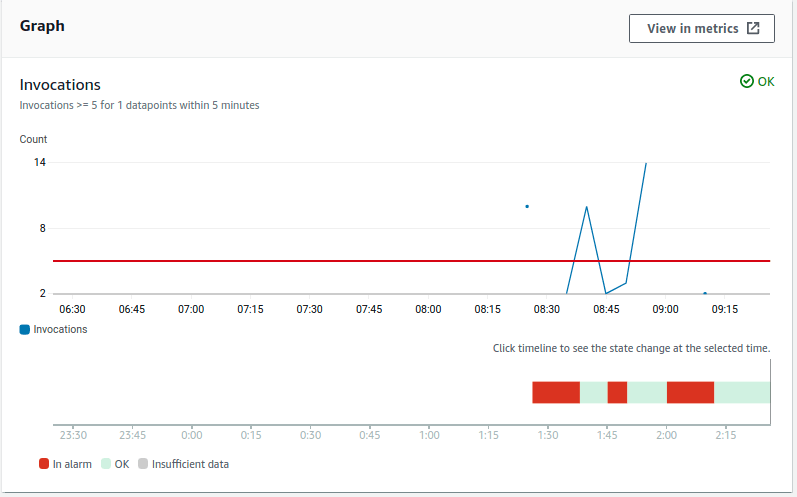
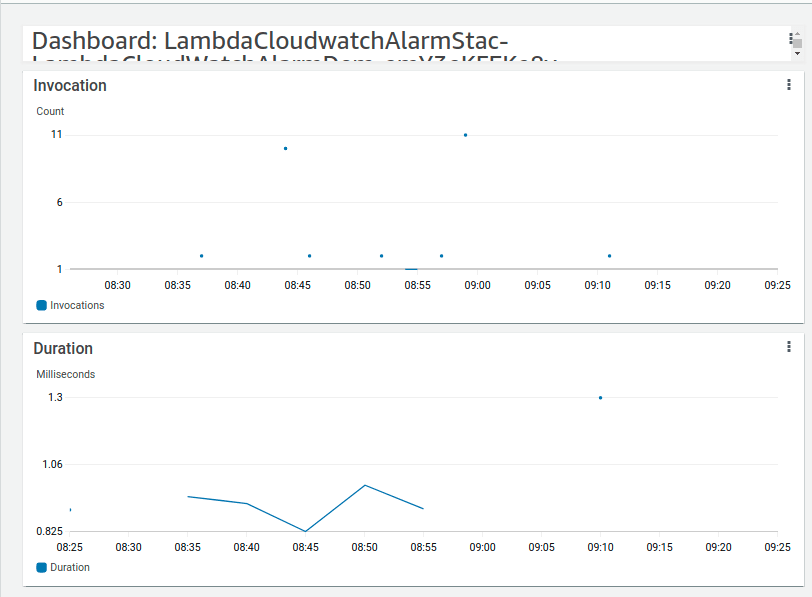
This note show a basic example how to use CloudWatch to monitor a Lambda function and notify when number of invocation greater than X within several minutes.
Metrics to monitor
- CloudWatch metrics for a Lambda fuction
- Number of invocation within 5 minutes (period)
- CloudWatch alarm
- Compare the metric with a threshold > X
- Evaluation period 1
- Action sends SNS notification
- CloudWatch dashboard
- Number of invocation within each data point of 5 minutes
- Average duration of invocation
Some notes
- CloudWatch logs are stored for 15 months, need to save to S3 if need longer
- Lambda sends logs to CloudWatch per 1 minute
- Principle to prevent premature/false alarm by M out of N (the trailing window)
Stack in CDK
create a lambda function
const fn = new aws_lambda.Function(
    this,
    "LambdaCloudWatchAlarmDemo",
    {
    runtime: aws_lambda.Runtime.PYTHON_3_8,
    handler: "index.handler",
    timeout: Duration.seconds(90),
    code: aws_lambda.Code.fromAsset(
        path.join(__dirname, "lambda")
    )
    }
)
create cloudwatch alarm
const alarm = new aws_cloudwatch.Alarm(
      this,
      "LambdaInvocationAlarmDemo",
      {
        metric: fn.metricInvocations(
          {
            statistic: 'sum',
            period: Duration.minutes(5)
          }
        ),
        threshold: 5,
        evaluationPeriods: 1
      }
    )
add alarm action
 alarm.addAlarmAction(
      new aws_cloudwatch_actions.SnsAction(aws_sns.Topic.fromTopicArn(
        this,
        "CodePipelineNotification",
        "arn:aws:sns:ap-southeast-1:account_id:CodePipelineNotification"
      ))
    )
cloudwatch dashboard
// title
dashboard.addWidgets(
      new aws_cloudwatch.TextWidget({
        markdown: `# Dashboard: ${fn.functionName}`,
        height: 1,
        width: 24
      })
    )
// number of invocation
 dashboard.addWidgets(
      new aws_cloudwatch.GraphWidget({
        title: "Invocation",
        left: [fn.metricInvocations(
          {
            statistic: 'sum',
            period: Duration.minutes(1)
          }
        )],
        width: 24
      })
    )
// duration
 dashboard.addWidgets(
      new aws_cloudwatch.GraphWidget({
        title: "Duration",
        left: [fn.metricDuration()],
        width: 24
      })
    )


Top comments (0)