TL;DR
🍬 Set your Loki HTTP URL to:
http://loki.loki-stack.svc.cluster.local:3100
Contents
Note: This guide assumes you do not have another Loki service running, and that the Loki service installed by DigitalOcean is called loki.
Prerequisites
- A DigitalOcean account.
- A kubernetes cluster set up on DigitalOcean.
- Prometheus Monitoring Stack already installed as a 1-click application.
- Loki stack already installed as a 1-click application.
- Administrator privileges in the Grafana dashboard which exists in the
kube-prometheus-stacknamespace. - DNS resolver (comes as standard with DigitalOcean's kubernetes service).
- You're using the defaults of the 1-click installers.
-
You can port forward the Grafana service using
kubectl(needs to be installed independently on your local machine, and connected to your cluster) to access your Grafana dashboard, e.g:
kubectl port-forward svc/kube-prometheus-stack-grafana -n kube-prometheus-stack 3000:80-
Note: This example assumes port
3000is available on your machine. If it's already in use, change the3000:80part of the command to something else, followed by:80, e.g.5000:80. - You can then access your Grafana dashboard by navigating to:
http://localhost:3000in your browser, or whatever you've set your local port as.
-
Note: This example assumes port
Introduction
DigitalOcean allows you to install a Prometheus monitoring stack using a 1-click installation option, alongside a Loki stack.
The problem is, you end up with two sets of Grafana dashboards that are disjoint from each other; one in the kube-prometheus-stack namespace created by the Prometheus Monitoring Stack's 1-click installer, and one in the loki-stack namespace created by the Loki 1-click installer.
My goal was to have the Grafana dashboard in the kube-prometheus-stack display logs from the Loki service running under the loki-stack namespace.
Here's how I did it...
Add Loki As A Data Source
From your browser, navigate to the Grafana dashboard which exists in the
kube-prometheus-stacknamespace (see prerequisites if you're not sure how). On the side navigation panel of the Grafana UI, hover over ⚙Configurationto reveal a sub menu. Inside this sub menu, selectData sources.
Click on the
Add data sourcebutton.
Find
Lokias a data source and clickSelect. Note: You may need to search forLokiin the search bar to find it.
-
The only field you need to enter is the
URLfield. Use the following value:
http://loki.loki-stack.svc.cluster.local:3100
Afterwards, clickSave & testto apply your settings. (Didn't work?)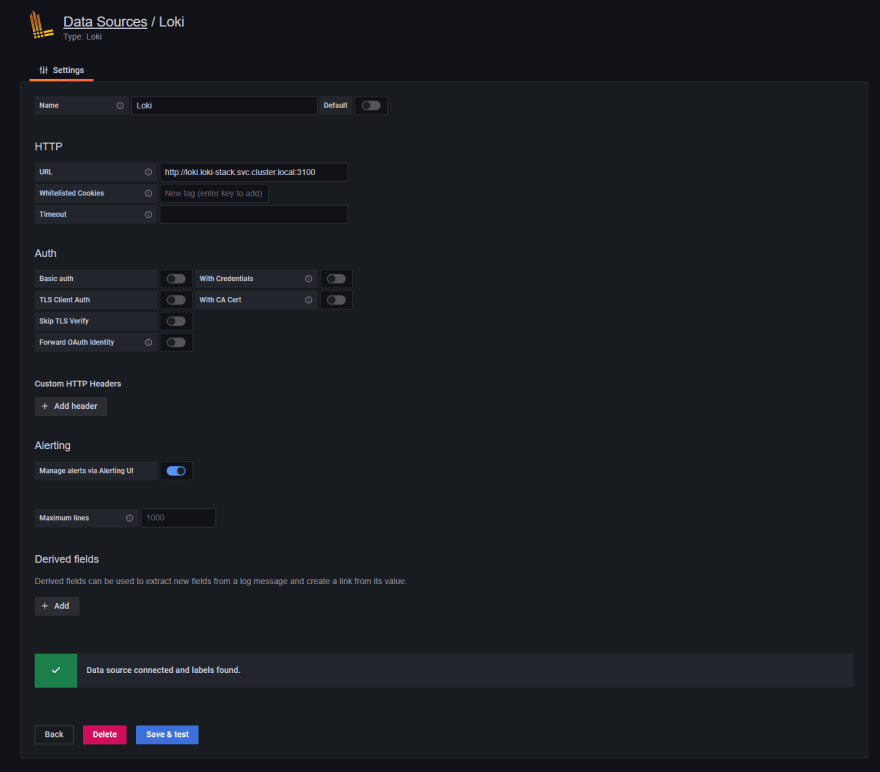 Note: If you have a previous Loki data source added, rename this new source aptly, then proceed with your chosen name for step 8.
 If you already have a dashboard created, skip this and go to step 6.
Create a new dashboard by hovering over the ➕Createmenu item on the left navigation bar. In the sub menu revealed, selectDashboard.
Click the
Add panelicon on the top right of the dashboard.
Select
Add an empty panel.
Configure the data source to be
Loki(or the name given to the data source in step 4).
Click on the visualisation type to change it from the default (in this case, time series), to
Logs.
i.
ii.
-
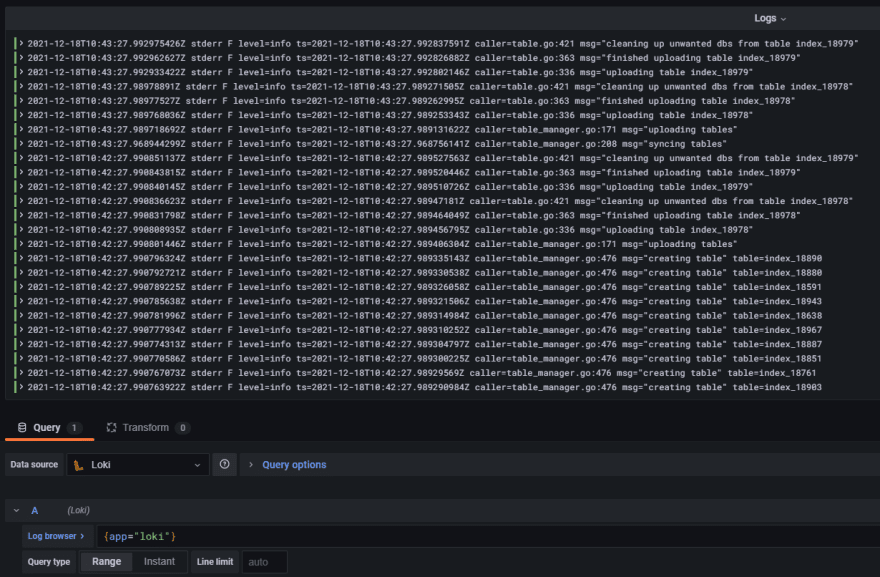
Enter a query to read the stdout of a pod, for example:
{app="loki"}
(Optional) Consider reducing the number of data points being requested to something more modest, e.g. 100.

(Optional) If your logs are timestamped, you may be able to group them and format the timestamp.

Apply your changes.

If all goes well, you should be able to see your desired logs using Loki, as installed by DigitalOcean's 1-click installer. 🥳 
How Does It Work?
The Loki 1-Click installer creates a service called loki in the loki-stack namespace, with an endpoint which the DNS resolver can interpret using the following syntax:
<service_name>.<namespace>.svc.cluster.local
Loki is running inside a pod where port 3100 is being used. Thus, the complete syntax is:
<service_name>.<namespace>.svc.cluster.local:<port>
Troubleshooting
I'm not an expert. 🤷♂️
502: Bad Gateway
Translation: Loki is not accessible using the URL you've provided. That probably means your installation is different to what the 1-click installer provides, or DigitalOcean has changed the way it installs Loki after this article was written.
Data source connected, but no labels received
The most likely culprits are:
- You're pointing to the wrong service. Be sure to double check the name of the service using
kubectl get svc -n loki-stack, and verify that a service with the namelokiexists. - The Loki service has a different endpoint. Verify that the endpoint with the name
lokiexists usingkubectl get endpoints -n loki-stack. - A firewall policy. GG well met. ☠ Just kidding, but I'm no expert on kubernetes or its network policy configurations.

Top comments (0)