Dynamics AX works well until it comes to a grinding halt. Without any software or hardware configuration change. How come?
Enter SQL Server Query Optimizer. And how to tame it.
So occasionally some part of functionality looses performance (i.e you can never finish your operation, it just hangs). Sometimes it impacts so many areas that various real life operations are severely impacted. Having experience administering this particular system meant I should look at SQL Server that causes most of performance issues.
Finding the issue
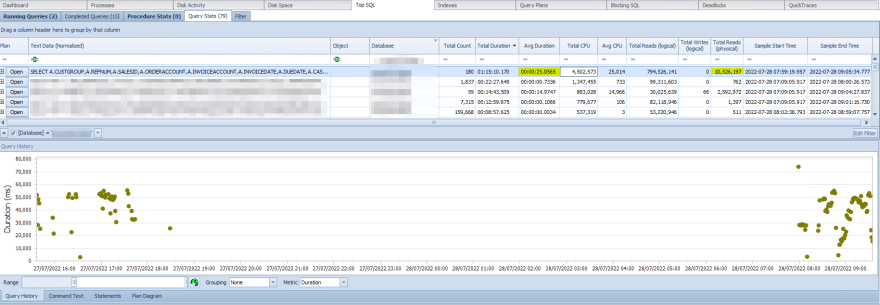
- The first thing is to look at queries which take most of the time in particular timeframe. So someone complains something is going bad - I look at last 2 hours of data collected with SQL Sentry (Now SentryOne)
* -
A-ha, some very suspicious query - average execution time is ~25s. Moreover it does many physical reads (reads from disk, data not cached into RAM). This was very easy to spot, but sometimes you get bad queries with 100ms execution time.
(@P1 nvarchar(5),@P2 nvarchar(21),@P3 datetime)SELECT
<list_of_224_columns> FROM CUSTINVOICEJOUR A WHERE
((DATAAREAID=@P1) AND ((LEDGERVOUCHER=@P2) AND (INVOICEDATE=@P3)))
A super simple query if you ask me, albeit pretty wide one.
-
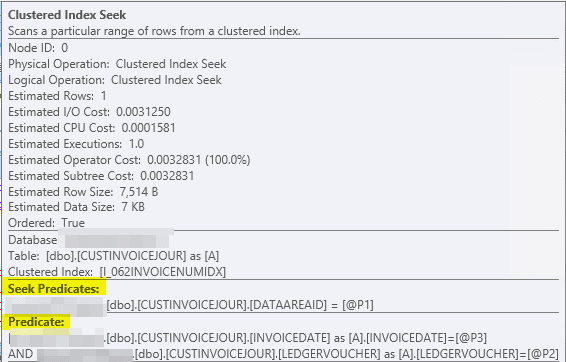
Lets look at the query plan. On Query History page I can right click and press Open Plan. At first I see a Clustered Index Seek and nothing else - looks perfect.

Until I put my mouse over that index to see what columns it seeks over. I look at Seek Predicates (columns which utilize index) and Predicate (columns which could utilize index, but does not). And we see only 1 column
DATAAREAIDat Seek Predicates, which is a very rough data categorization column with only a few distinct values in there.So it is more like data scanning most of the table rows each time this query executes. At previous screenshot we see it did that 180 times over period of ~2hrs.
What we ideally want to see there is many Seek Predicate columns and possibly few Predicate ones (but it depends on the query whether it is possible). So we are dealing with Queries that have parameter sensitive plan (PSP) problems.To get a sense of how indexes are used, what does clustered index mean, what is key lookup (or bookmarked lookup) look at Clustered Index article.
-
So culprit is identified (diagnostics is usually most of the work). Isn't there a better index for this query to use? Let's check. Execute
sp_helpindex 'dbo.CUSTINVOICEJOUR'- or better yetsp_sqlskills_helpindex 'dbo.CUSTINVOICEJOUR'(sp_sqlskills_helpindex)From query plan we saw it uses
INVOICENUMIDXwhich is clustered index and it can only use first column for seek. However there is much better index:LEDGERVOUCHERIDXwhich has all 3 key columns that could be used for seeking:DATAAREAID,LEDGERVOUCHERandINVOICEDATE.
Why are we facing this issue?
Why did SQL Server choose obviously much more worse index? My theory is as follows: The Query plan estimated (out of STATISTICS) that there will be only 1 row. Why? If you look at query plan XML, you can see on what query parameters (Actual values for @P1, @P2, @P3) were present when SQL decided to generate & cache this particular query plan:
                <ParameterList>
                  <ColumnReference Column="@P3" ParameterCompiledValue="'2022-07-26 00:00:00.000'" />
                  <ColumnReference Column="@P2" ParameterCompiledValue="N'<something>'" />
                  <ColumnReference Column="@P1" ParameterCompiledValue="N'DMT'" />
                </ParameterList>
@P1 corresponds to DATAAREAID. Lets look at statistics - how much rows does SQL server expect to find:
DBCC SHOW_STATISTICS ('dbo.CUSTINVOICEJOUR', 'DATAAREAID')
Could not locate statistics 'DATAAREAID' in the system catalogs.
Alright, no statistics for particular column - we have to look at index statistics then:
DBCC SHOW_STATISTICS ('dbo.CUSTINVOICEJOUR', 'I_062LEDGERVOUCHERIDX')
Sorry I'm not showing you actual values, however none of the rows say DMT. Basically, when SQL server updates statistics (it looks at each 5th row or whatever percentage of rows you ask SQL to look at) - and it didn't see even one where there would be DATAAREAID = DMT. Thus SQL Server estimates there is 1 row (it never estimates 0). However SQL thinks: well, if I'll get 1 row from index LEDGERVOUCHERIDX using only first key column DATAAREAID, I'll have to lookup all those selected columns within clustered index INVOICENUMIDX - why not just directly get that row from INVOICENUMIDX which also begins with DATAAREAID and spare a key lookup (as all the data will already be within the page)? (Understanding Key Lookups)
For these particular parameters SQL Server has really found the best way to return the data, no questions about that.
However, the problem (or a feature) is that SQL Server caches this query plan. Suppose DATAAREAID now would be something that statistics shows us we have 352 million rows - and SQL will now get each of this row, filter out linearly INVOCIEDATE and LEDGERVOUCHER (because chosen index doesn't have data arranged in a way that index can be utilized to not read that data in the first place).
Solutions?
- How about preventing SQL server cache this particular query plan at all? It is possible to do with plan guides, but it is a bad idea: if query is set to execute multiple hundreds of times per second, then query plan compilation adds >10ms of time to execute. Ideally this query would execute in ~1ms time (working few years on the same system kind of tells you how long that simple query should take), so we don't want at LEAST 10x overhead to query execution. Bad idea in this case. But could work for queries that get executed few times OR queries that by itself takes 50ms or more to run.
- Previously mentioned Queries that have parameter sensitive plan (PSP) lists other hints we could use, but I'll go over and use my favorite, most stable option.
- Tell SQL Server to use particular index using plan guides. That's what we are going to do.
What are plan guides? As documentation puts it:
Plan guides let you optimize the performance of queries when you cannot or do not want to directly change the text of the actual query in SQL Server. Plan guides influence the optimization of queries by attaching query hints or a fixed query plan to them. Plan guides can be useful when a small subset of queries in a database application provided by a third-party vendor are not performing as expected.
Perfect:
- I cannot directly change the query
- I can influence query optimization
- Subset of queries from third-party vendor query is not performing well.
Creating plan guide
EXEC sp_create_plan_guide
    @name = N'[QNW-319-445612-custinvoicejour-perf]',
    @stmt = 'SELECT <list_of_224_columns> FROM CUSTINVOICEJOUR A WHERE ((DATAAREAID=@P1) AND ((LEDGERVOUCHER=@P2) AND (INVOICEDATE=@P3)))',
    @type = N'SQL',
    @params = N'@P1 nvarchar(5),@P2 nvarchar(21),@P3 datetime',
    @hints = N'OPTION(TABLE HINT(A, INDEX(I_062LEDGERVOUCHERIDX)))'
GO
When plan guide is created, it immediately invalidates the existing plan and when such query comes in, generates new query plan taking into account plan guide hints.
Now we must validate:
- Whether new query plan uses this plan guide (i.e we provided correct
@stmtand@paramsvars forsp_create_plan_guide) - What is the performance of the query - better or worse?
To validate the first point, we must get query from plan cache and find PlanGuideName attribute within XML. Here is a query that, among some statistical stuff, has uses_plan_guide column and actually provides a way to open query plane and validate that plan guide is in use:
select TOP 100
    execution_count,
    sql_handle, qs.query_hash, plan_handle, qs.query_plan_hash, qt.text,
    [query_plan] = CAST (qp.query_plan AS XML),
    creation_time,
    last_execution_time,
     qs.total_logical_reads,
     qs.last_logical_reads,
     qs.min_logical_reads,
     qs.max_logical_reads,
     qs.last_logical_writes,
     qs.min_logical_writes,
     qs.max_logical_writes,
     [avg_logical_reads] = qs.total_logical_reads / 1.0 / qs.execution_count,
     [total_elapsed_time_ms] = qs.total_elapsed_time / 1000.0,
     [last_elapsed_time_ms] = qs.last_elapsed_time / 1000.0,
     [min_elapsed_time_ms] = qs.min_elapsed_time / 1000.0,
     [max_elapsed_time_ms] = qs.max_elapsed_time / 1000.0,
     [avg_elapsed_time_ms] = qs.total_elapsed_time / qs.execution_count / 1000.0,
     [min_worker_time_ms] = qs.min_worker_time / 1000.0,
     [max_worker_time_ms] = qs.max_worker_time / 1000.0,
     [avg_worker_time_ms] = qs.total_worker_time / qs.execution_count / 1000.0,
     [force_index] = CASE CHARINDEX(N' INDEX(', qt.text) WHEN 0 THEN 0 ELSE 1 END,
     [uses_plan_guide] = CASE CHARINDEX(N' PlanGuideName=', qp.query_plan) WHEN 0 THEN 0 ELSE 1 END,
     [create_plan_guide] = 'sp_create_plan_guide_from_handle @name = N''[provide_name]'', @plan_handle = ' + CONVERT(NVARCHAR(MAX), qs.plan_handle, 1) + ', @statement_start_offset = ' + CAST(qs.statement_start_offset as NVARCHAR(100)) -- you can use this statement to force this query use currently cached query plan
FROM
   sys.dm_exec_query_stats qs
   CROSS APPLY sys.dm_exec_sql_text (qs.[sql_handle]) AS qt
   CROSS APPLY sys.dm_exec_text_query_plan(qs.plan_handle, qs.statement_start_offset, qs.statement_end_offset) AS qp
WHERE
    qt.text LIKE N'%<list_of_224_columns> FROM CUSTINVOICEJOUR A WHERE ((DATAAREAID=@P1) AND ((LEDGERVOUCHER=@P2) AND (INVOICEDATE=@P3)))'
ORDER BY qs.total_worker_time DESC
And this query actually gives answer to the second question too - avg_elapsed_time_ms is of intereset. For me it reads 0,32ms. I can't ask for more! Moreover, within 41 seconds it has execution_count of 515 times. Compare that to 249 executions in 186 minutes...
In fact, the job completed so fast, it is no more to be seen on SQL Sentry query stats which has configured 5 seconds of total duration for it to be included. So unless it executes 15k+ times within a minute, I'm not seeing it there.
By the way, if you ever delete/rename index, that doesn't mean SQL Server will error out executing that query - it will disregard the plan guide when compiling query plan. There are performance counter to monitor to know when you have stale plan guides: Misguided Plan Executions/sec
Microsoft is on it
This is certainly a flaw of SQL Server being dumb. However since SQL Server 2017 and onwards, Microsoft is tackling performance issues with some intelligent query processing which includes various feedback mechanisms that SQL Server keeps an eye on whether the particular query plan strategy at hand is good enough and adjusts accordingly. These look promising:
If only the application supported latest-and-greatest SQL Server... so I haven't been able to test out those features.
Anyways, I'm happy that the results are delivered and the system can continue working until the next query is to be found misbehaving...
* Note that for newer SQL Servers there are tools that may assist you with finding bad performing queries, like Query Store. For more advanced DB Users Data Collection could be used or just querying plan cache and sorting by qs.total_elapsed_time if the query plan is still there. System uses SQL Server 2008R2 that doesn't have Query Store, so using SQL Sentry is just doing the job faster.


Top comments (0)