
A few weeks ago we posted the "How we built a serverless Stonks checker API for Wall Street Bets" article. And ever since, we've seen quite a lot of volume in the Stonks checker app. In this follow-up article, we will show you some interesting findings around the API.
Last Two Weeks Summary
Over the past three weeks, we have seen a good amount of usage of the API we set up. You can see that there was a nice spike soon after the story broke. To note is that we have HTML caching setup in the returned value from the Lambda function. So you can see that about half the time, a Lambda is not called, and the results are a cached HTML version.

Dashbird Findings
The Hot Stock Checker (HSC) has run for a month now and got used quite a bit. We added the Dashbird integration to the AWS account that hosted the HSC infrastructure and looked at the past three weeks.
So, let's jump right in and look at the Dashbird metrics of the Lambda function.

In the three weeks of running the HSC, we got the most invocations at the launch, which is obvious. But Dashbird also shows other interesting findings.
The best insight here is, it didn't cost us any money to run this application. The usage was so low that we never left the free tier of AWS Lambda.
You can learn more about saving money on your Lambdas in this article about 6 cost optimization strategies that actually work.
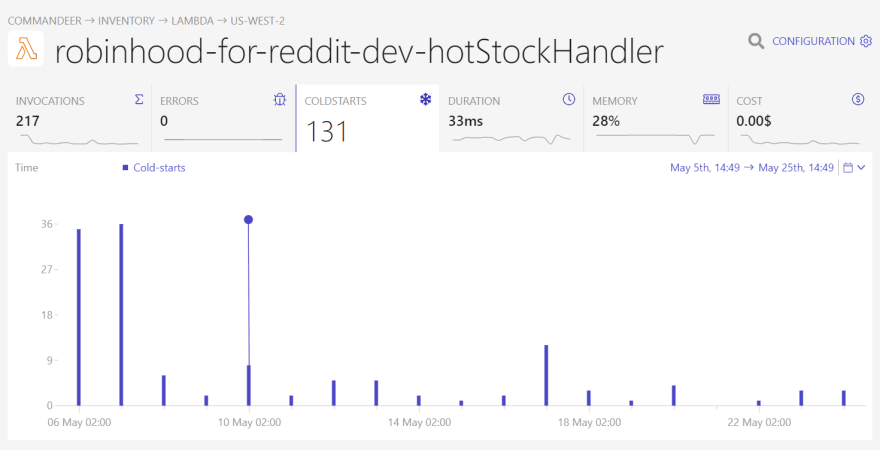
Over half of these invocations were cold-starts. In this specific application, it's to be expected since it doesn't have enough invocations per second to keep around a warm Lambda function. Still, if this was a production application that has to deliver on SLOs, it could be a good idea to use provisioned concurrency for the Lambda function to get rid of these cold-starts. This would also lower the average duration of our function.

The next point is memory usage. The Lambda function is configured with 256 MB of memory but only uses 28% of it. This is a bit tricky to optimize. In a low memory config like that, it's not advisable to lower the memory consumption because memory config implicitly configures CPU performance.
So, if we lower the memory config, things would get cheaper but also slower. In the case of a Lambda function connected to an API Gateway, this could lead to higher latency and, in turn, a worse user experience. If it's just about saving costs, and we would leave the free tier with our Lambda function, we could set the memory to 128 MB and save some money.

We can also see the last invocation, the last error, and an insight.
We can use the last invocation to get details about that specific invocation, which isn't very interesting in this project. So let's move to the last error.
The last error was 4 months ago, but Dashbird was integrated with that AWS account much later. This illustrates how Dashbird works under the hood. It reads data from CloudWatch Logs, which get written right when a Lambda function was deployed. So the data is already here before a potential customer decides to use Dashbird. This enables Dashbird to show us data from before its integration.
The way Dashbird uses already existing logging data especially shines with the Dashbird Well-Architected Lens. It is built around the automated AWS Well-Architected Reports, based on the AWS Well-Architected Framework's set of whitepapers containing best practices for building software on AWS infrastructure.
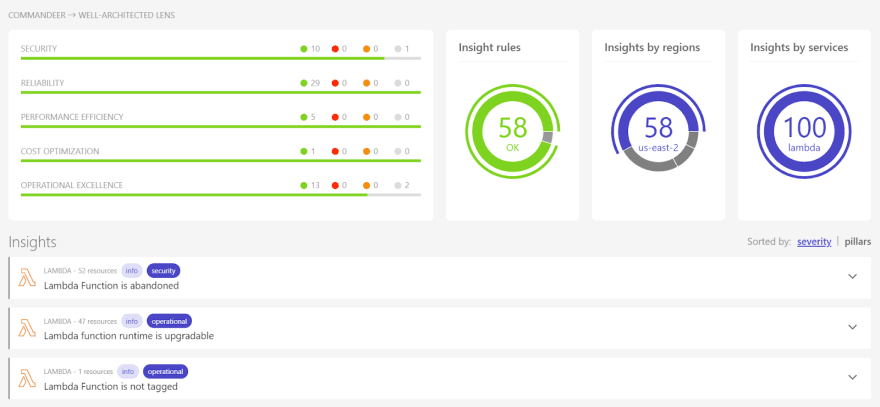
The old logs aren't very interesting on their own. After all, we could open up CloudWatch ourselves and look for four months old errors. But with the Dashbird Well-Architected Lens, we can get higher-level insights about our infrastructure, like Lambda functions that aren't used anymore or, like shown in the screenshot above, an upgradable Lambda runtime.
You can check out the insights Dashbird provides to you on top of CloudWatch logs in our event library. It doesn't just come with insights for Lambda, but also API Gateway, DynamoDB, and even Kinesis.

Further reading:
Introducing Dashbird's automated Well-Architected Reports


Top comments (0)