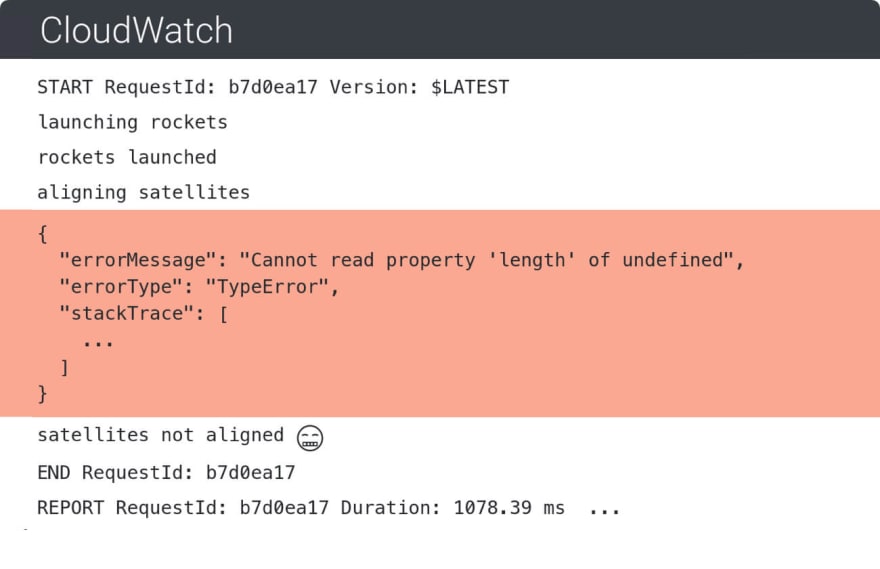
Traditionally in white-box monitoring, error reporting has been achieved with third party libraries, that catch and communicate failures to external services and notify developers whenever a problem occurrs. I'm here to argue that for managed services this can be achieved with less effort, no agents and without performance overhead.
In fact, there's a lot of reasons why you shouldn't use classical error-reporting tools in AWS Lambda. Most critical of them is that error-handling libraries in the code are blind to Lambda specific failures, such as timeouts, wrongly configured packages and out of memory failures. In addition, there is an issue with coverage -- implementing error reporting for each function is a lot of work. Whenever you add a service to your infrastructure, you must go through setting up error tracking and monitoring for it and forgotting to do it can result in blind-spots in your system.
Luckily, those problems can be solved quite easily and in most cases it's just a matter of adopting new tooling and development practices.
About the word "observability"
Before getting into details it's important to understand the idea behind observability. It doesn't mean that you'll have visibility or that you can even monitor your service right of the bat. It means that the system makes itself understandable by outputting data that enables the developer to ask any kind of arbitrary questions about the current or past state of the system. Fortunately the information emitting aspect is well implemented in AWS and serverless users for example have an opportunity to get visibility without specifically implementing extra stuff in their code.
Apart from CloudWatch logs, we could leverage AWS APIs for resource discovery and X-ray and CloudTrail for tracing and connecting execution flows.
We can make failure detection better today
The ability to detect failures across all functions and connect them with specific invocations, view logs and pull X-ray traces for them significally reduces the mean time to resolution in failure scenarios.
Lets break it down
The only prerequisite for log-based error detection and visibility in general is that logs are pushed to CloudWatch (in most cases that is the default). From there on, we can do some smart pattern matching and deduction to detect failure scenarios.
On top of that, logs contain a lot of other data that indicate latency and memory usage and allow us to connect requests with AWS X-ray and search for a trace report for a specific request. All this allows us to gather a lot of context in order to understand what went wrong in a particular case.
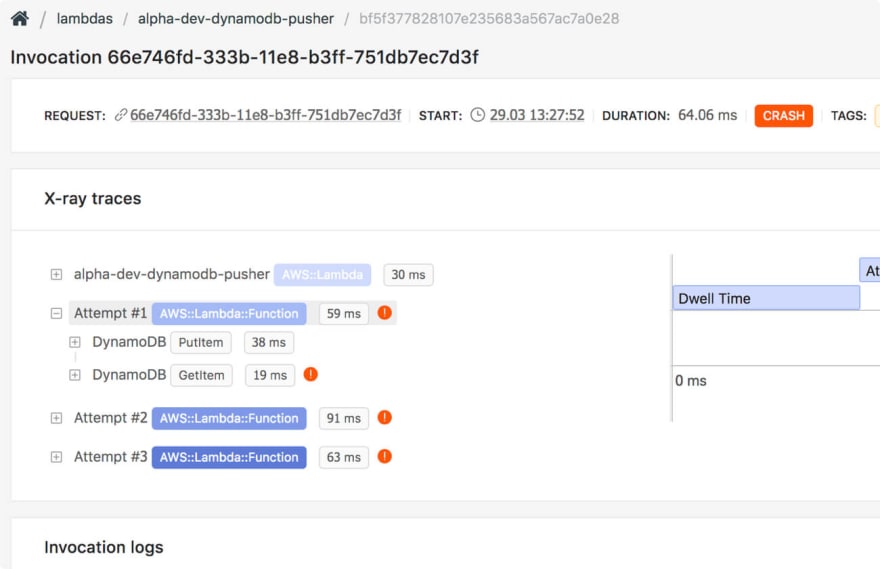
Here's what an X-ray trace contains when you search for it for a specific Lambda request. This enables you to catch errors in services your Lambda function touches.
Conclusion
With the emergence of managed and distributed services, the monitoring landscape will have to go through a significant change to keep up with modern cloud applications. Currently, devops overhead is one of the biggest obstacles for companies looking to use serverless in production and rely on it for mission-critical applications. Our team at Dashbird is hoping to solve that one problem at a time.
Dashbird takes about 5 minutes to set up, after which you will get full visibility into your serverless applications. Give it a try by signing up here.


Top comments (0)