![Cover image for Serverless observability and real-time debugging with Dashbird [tutorial]](https://media2.dev.to/dynamic/image/width=1000,height=420,fit=cover,gravity=auto,format=auto/https%3A%2F%2Fdev-to-uploads.s3.amazonaws.com%2Fuploads%2Farticles%2Fmdgy41pt8wxx46utfmct.png)

Image by Dashbird.io
Systems run into problems all the time. To keep things running smoothly, we need to have an error monitoring and logging system to help us discover and resolve whatever issue that may arise as soon as possible. The bigger the system the more challenging it becomes to monitor it and pinpoint the issue. And with serverless systems with 100s of services running concurrently, monitoring and troubleshooting are even more challenging tasks.
In my last article, I introduced Dashbird.io, serverless monitoring and observability platform specifically designed to provide enhanced monitoring, actions, and architectural improvements for your AWS-based serverless systems and how it fills the gaps left by traditional monitoring services.
To learn more about Dashbird's features and how to set it up, check out my previous article.
Lambda Use Case for Dashbird
Dashbird has a lot of cool features to offer and in this article, I'll be specifically showcasing how we can use those cool features to help debug serverless systems. For demonstration purposes, I have devised a lambda-based serverless use case.
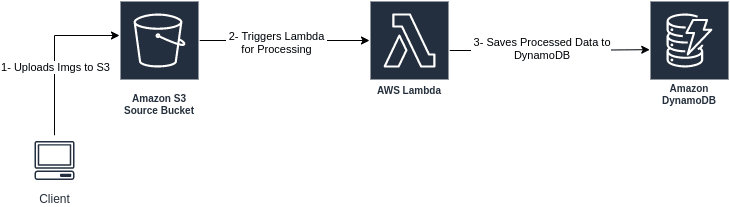
Lambda Use Case Architecture
The architecture is simple enough, the client uploads images to a source S3(to learn more about S3 click here) bucket. An S3 trigger is set up between our Lambda function (to learn more about lambda service click here) which is invoked by S3 whenever a PUT request(an image is uploaded) is made on the source bucket. The lambda function extracts the metadata information of the image and saves the data in our destination DynamoDB table. Check out this article to learn more about S3 and AWS Lambda Triggers.
We know AWS Lambda has its own set of challenges, a lot of times we run into various issues such as function time outs, out-of-memory issues, python exceptions, configuration errors, etc. Using the above architecture I'll be creating various scenarios to mock various challenges with AWS Lambda these include:
- Cold Starts and Latency Issues.
- Function Timeouts.
- Out of Memory Exceptions.
- Function Configuration issues.
- Lambda cost monitoring.
These challenges can be very well addressed using Dashbird which provides very precise information regarding each of the above-mentioned issues.
Using Dashbird to Manage Lambda Challenges
In this part of the article, I'll focus on how we can use Dashbird to efficiently manage some of the common challenges we face with AWS Lambda. If you haven't configured Dashbird with your AWS account yet check out my last article to learn how.
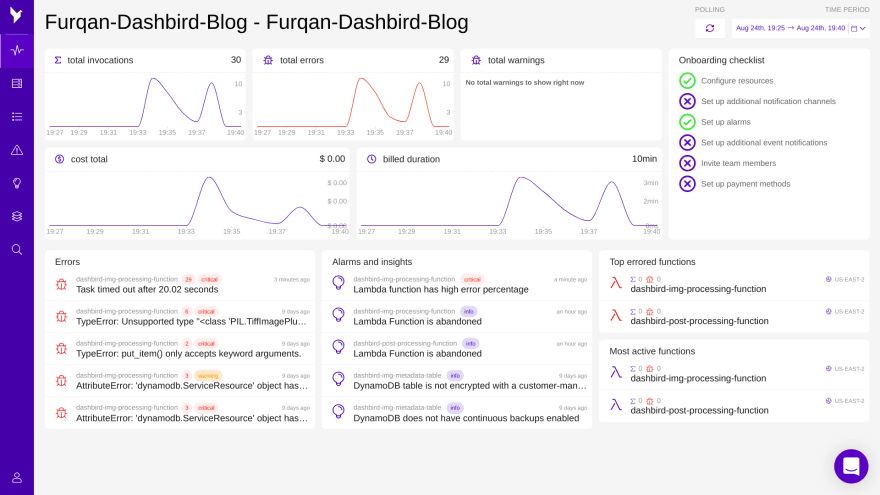
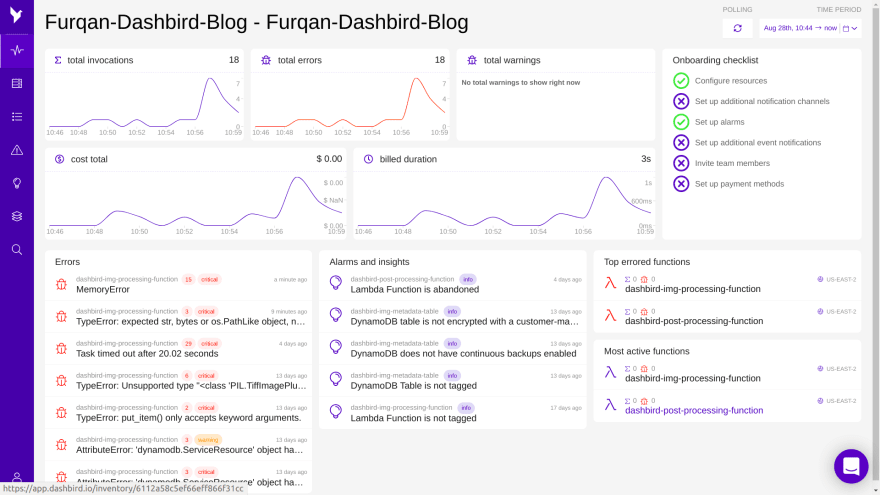
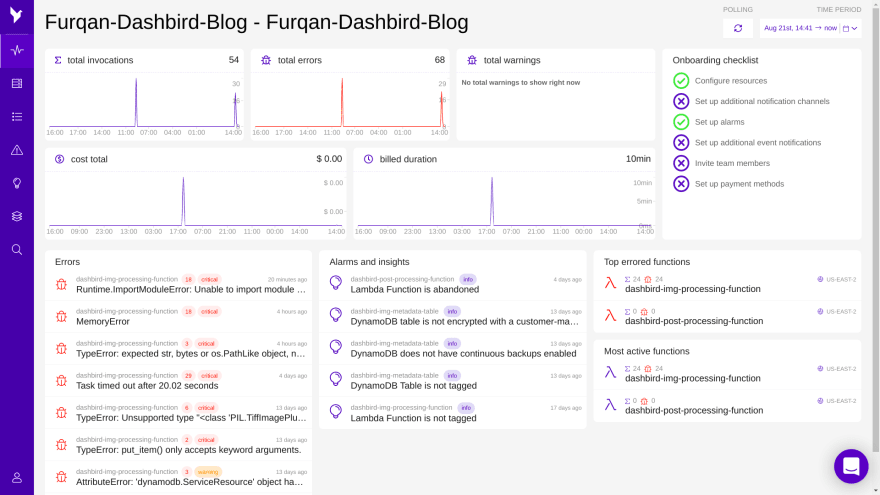
- Once we have set up Dashbird with our AWS account, Dashbird analyzes different services we are using from our account. Once logged in to Dashbird, we land on the dashboard which gives us a birds-eye-view of our entire account activity.

Dashboard
- From the dashboard, we can navigate to different modules of Dashbird to dig into different errors or warnings that may have occurred in our system. As we can see from above, I faced several errors while my system was running.
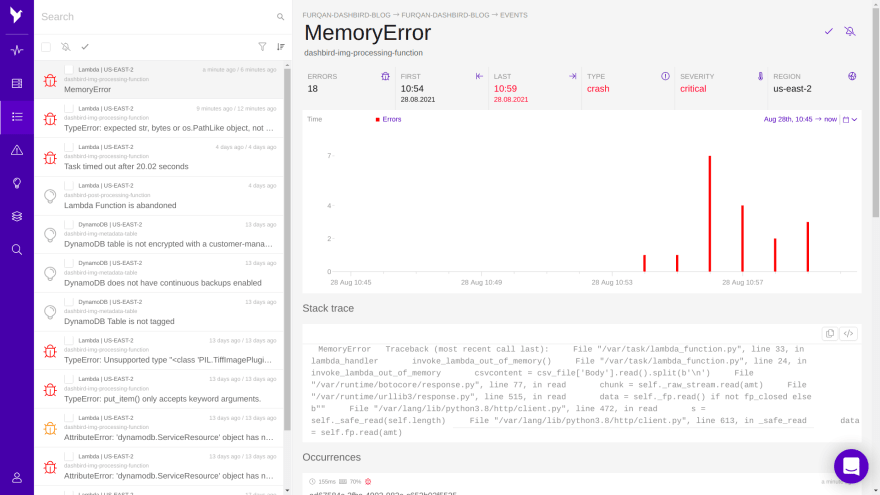
- Clicking on an error takes us to the 'Events' module, which details the error we faced.
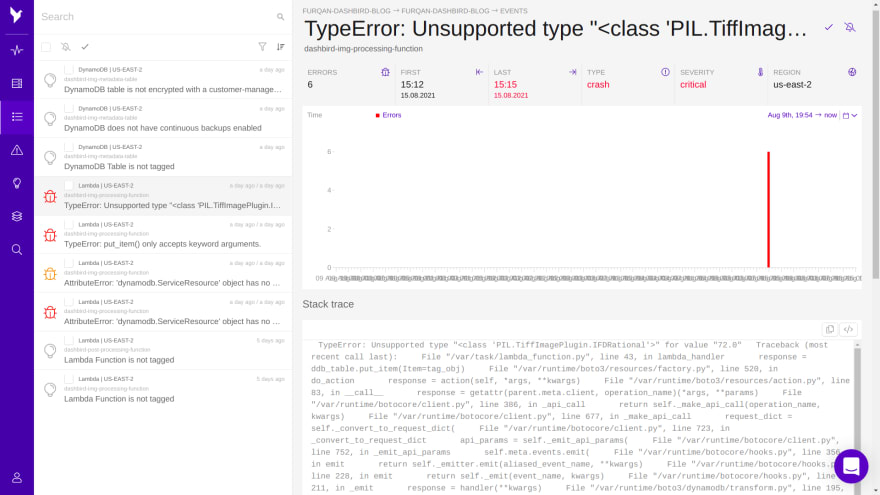
Dashbird's Event Module
Using Dashbird for monitoring Lambda Cold Starts and Latency Issues:
Cold starts are a major contributor to degrading lambda performance. Especially for real-time systems, the impacts of cold starts are not very desirable since with each added lambda cold start the latency experienced increases. Dashbird helps us to very efficiently analyze which of our lambda functions faced cold starts and its impact on the function latency.
From the Inventory module, we can easily analyze which of our functions are facing cold starts and from the Alarms module, we can set up alarms for timely alerting us whenever lambda cold starts exceed a certain threshold.
--- Monitoring Cold Starts and Function Latency:
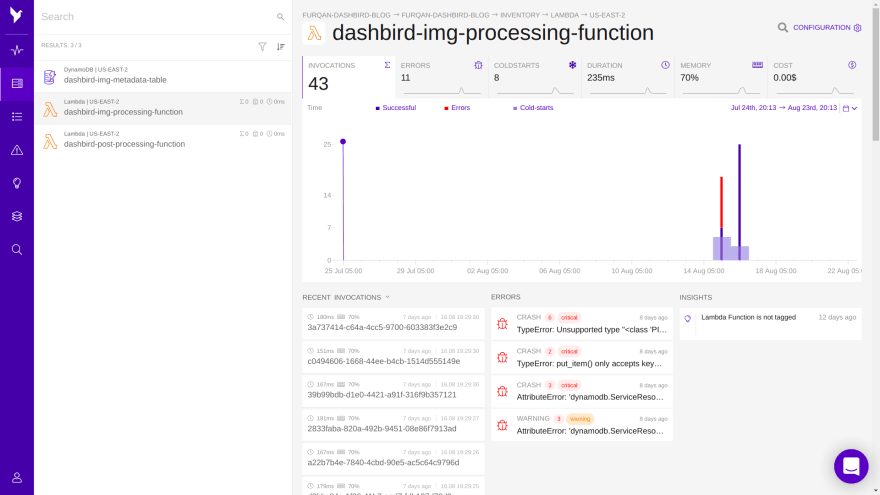
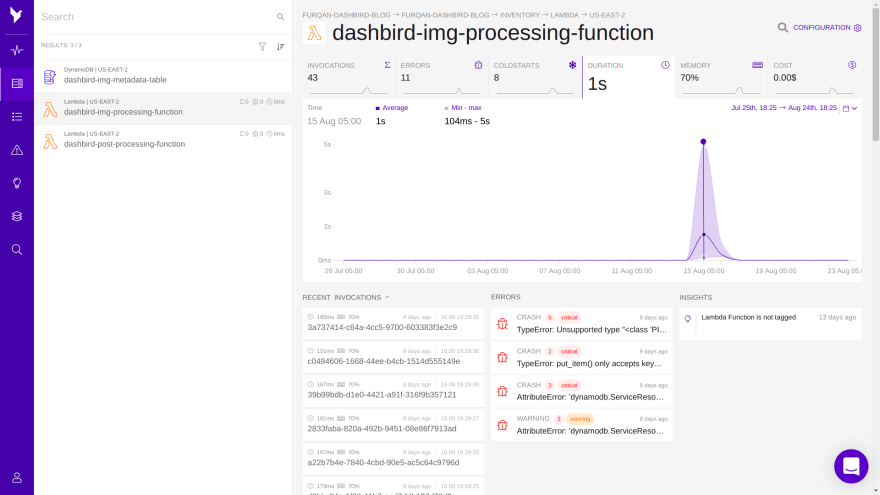
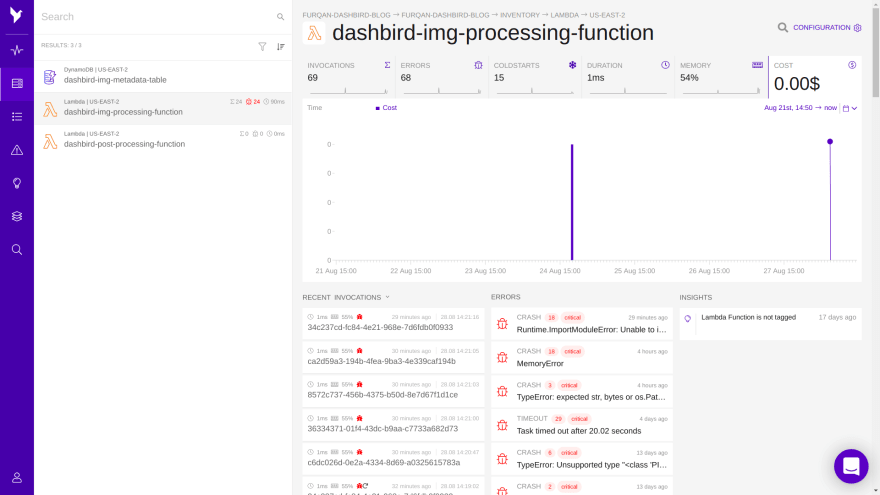
- From the navbar on the left click on "Inventory" and then click on the lambda resource you want to view. As we can see below, we get a lot of useful information regarding our Lambda function invocations like total invocations, how many errors occurred, how many invocations had cold starts, total duration of execution, percentage of memory consumed, and cost incurred.
1- Analyzing Lambda Cold Starts.
- Clicking on the "ColdStarts" tab further shows a graph of how many times our lambda function faced cold start and at what times it occurred.

2- Analyzing Lambda Cold Starts.
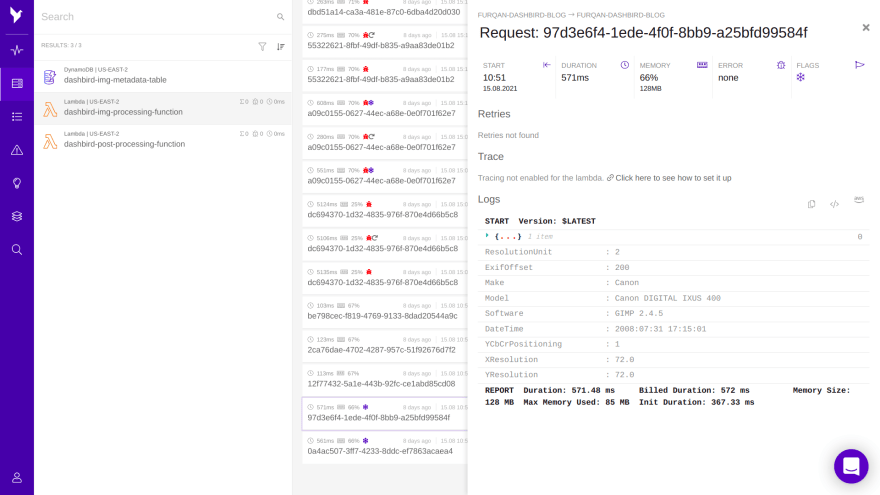
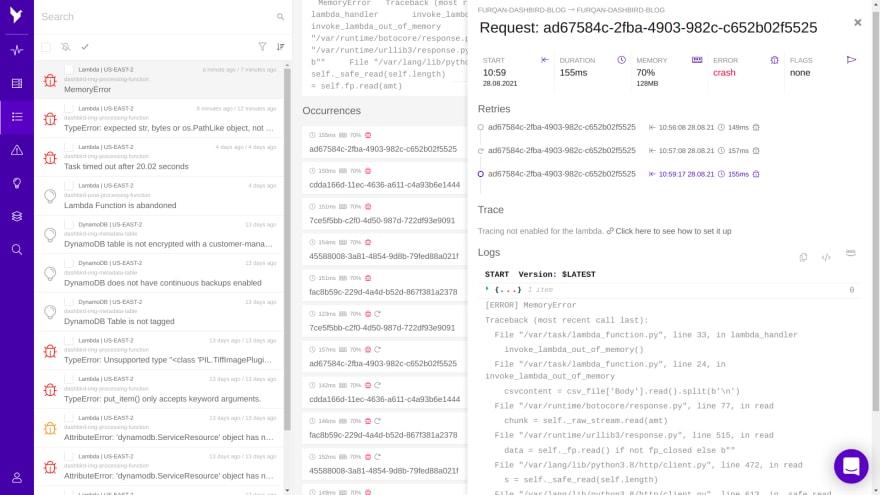
- We can also individually analyze a specific lambda invocation. In the "Recent Invocations" section at the bottom, click on the invocation you want to view which will further detail all the necessary information associated with that invocation.
- As we can see below, our lambda invocation is appropriately flagged with a cold start label.
3- Analyzing Lambda Cold Starts.
- Clicking on the "Duration" tab displays the total time of execution of all lambda invocations and also a curve plot displaying the average, min, and max execution times taken by our lambda invocations.

4- Analyzing Functions Latency.
5- Average, Min, Max Execution Duration.
- From the "Recent Invocations" section at the bottom, we can also see that the functions with cold starts have a greater execution duration than those without cold starts.
--- Setting up Alarms for Lambda Cold Starts and Latency Issues:
Other than monitoring lambda latency and cold starts, Dashbird also provides us with a great system alert offering using which we can set up metric-based alarms to timely notify us whenever our lambda functions are facing cold starts more than a certain desirable threshold or whenever a function's execution time is exceeding a certain time limit. I will discuss setting up lambda alarms in the coming section on Dashbird Alarms.
Using Dashbird to deal with Function Timeouts:
Lambda functions have a timeout configuration which is the maximum amount of execution time can have after which the function automatically timeouts. The minimum can be 1sec and the maximum value for a timeout can be 15mins(as of now). Oftentimes, our computations may exceed the timeout limit that we have set. For any such cases, we would want to monitor which functions are facing timeouts and act accordingly. With Dashbird, we can easily deal with Lambda timeouts:
- To demonstrate this behavior, I set the timeout for my "dashbird-img-processing-function" lambda to 20 sec, and within my function, I called python's sleep function with 30 sec sleep time. After redeploying I invoked my lambda function.
- On the "Dashboard", sufficient information was available to see from the total lambda invocations how many faced an error.
- In the "Errors" section on the bottom left, we can see that our "dashbird-img-processing-function" function faced the "Task Timed Out Error". We can also see the number of invocations(29) that faced the error and the severity(critical) of the error.
1- Analyzing Lambda Timeouts.
- Clicking on the said error takes us to the "Events" module. Here we can dig into more details. We can see when the first error occurred, when the last error occurred, the type of error(timeout), its severity, region in which the function is deployed. We also get the stack trace accompanying the error.

2- Analyzing Lambda Timeouts.
- From the "Occurrences" section at the bottom, we can also see the details for each individual invocation.
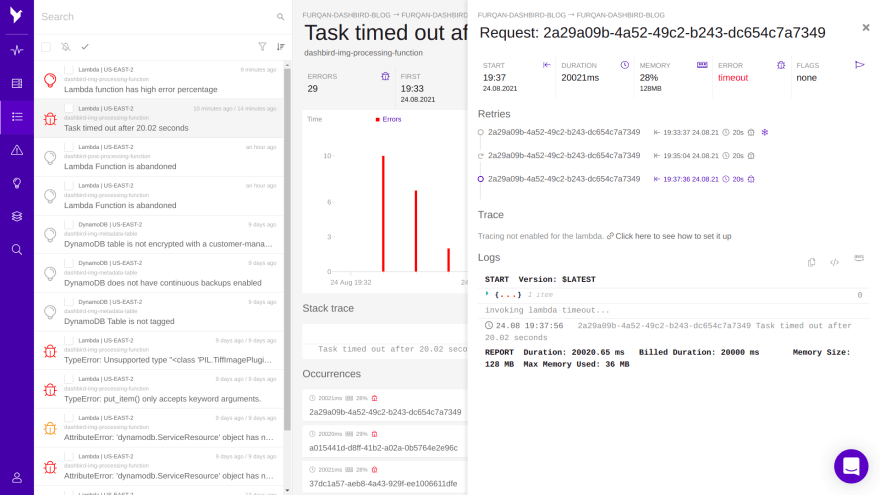
3- Analyzing Lambda Timeouts.
- Not only this, but Dashbird automatically sends an email alert to our registered email address (or Slack channel, webhooks or SNS) regarding the timeout error prompting us to take necessary actions to resolve the issue. Using the "Alarms" module, we can also set custom Alarms for lambda errors.
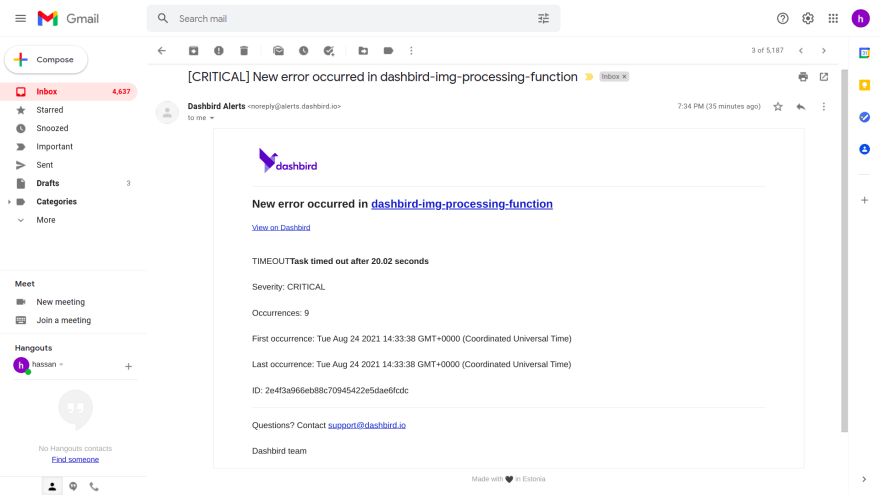
4- Analyzing Lambda Timeouts- Email Alerts.
Using Dashbird for Lambda Out of Memory Exceptions:
Just like Lambda has a timeout configuration parameter, there's also a memory parameter that defines the maximum amount of memory a Lambda function can use. The minimum we can set is 128MB and it can go up to a maximum of 10GB(as of now). When performing a memory-intensive task, it is very likely that the function's memory consumption goes beyond the memory limit we have set for our lambda function in which case, the function will throw an "Out of Memory Exception", halting the function's execution. Dashbird has also got this covered and provides us with proper insights and alerts to handle all "Out of Memory" exceptions.
- To demonstrate this use case, I set my lambda function's memory limit to 128MB and changed the function such that whenever it is invoked, it will load a large CSV file in memory forcing it to cause a "memory error".
- After invoking my lambda function, I could see on the dashboard module in my dashbird's account that indeed a memory error has occurred.
1- Analyzing Lambda Memory Errors.
- To dig more into the cause of the error, click on the MemoryError tab in the "Errors" section on the bottom left. This takes us to the "Events" module where we get a deeper insight regarding all our critical events.
- In this view, we can see how many of our lambda invocations caused a memory error, we get a time plot of when each error occurred, we can view the stack trace of the error and each individual invocation can be viewed separately to get even more insights.
- Dashbird automatically sent an email alert as well to the registered email address to inform about the "MemoryError" that occurred.
2- Analyzing Lambda Memory Errors.
3- Analyzing Lambda Memory Errors.

4- Dashbird's email alert for Memory Errors.
- Just like we can set up alarms for other metrics, Dashbird's "Alarms" module also has metrics for memory consumption which we can set as per our use case to alert us in case memory being used is above a certain threshold. More on Dashbird's alerts in the coming section.
Dashbird for Monitoring Function Configuration Issues
Lambda configuration errors are related to failed function initialization usually due to some improper import. The function execution halts and the function is unable to initialize because of some issue with some module we're trying to import. Just like other Lambda-related errors Dashbird has also got this covered.
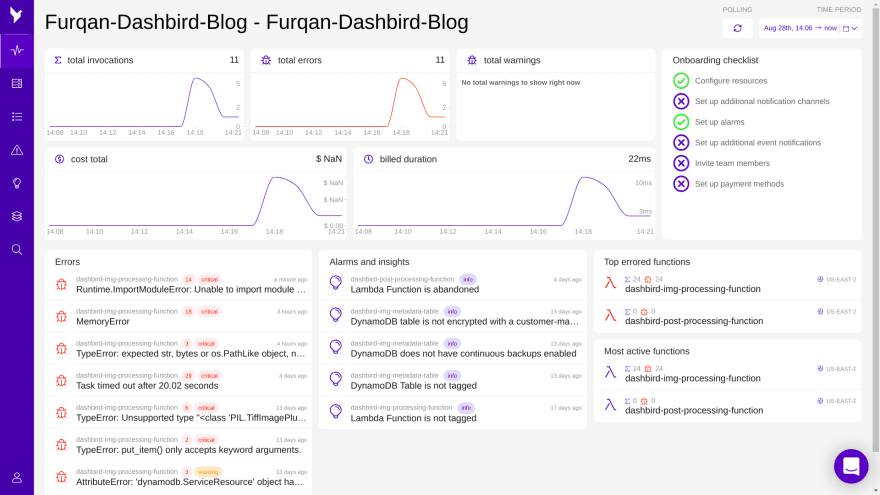
- To demonstrate Dashbird's ability to handle "Configuration Errors", I changed my Lambda function such that it tries to import a non-existent module causing a "Runtime Configuration Error".
- From the dashboard, we can see what error occurred and navigate to the "Events" module to get deeper insights. We can see how many of our lambda invocations caused the error, a time plot of when each error occurred, the stack trace of the error and each individual invocation can be viewed separately to get even more insights.
- And just like for all other errors, Dashbird automatically sent an email alert as well.
1- Analyzing Lambda Configuration Errors.

2- Analyzing Lambda Configuration Errors.

3- Analyzing Lambda Configuration Errors.
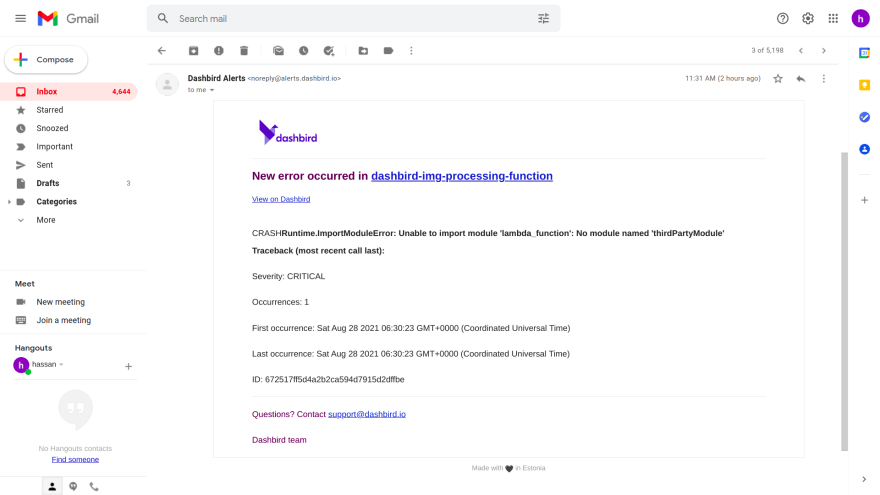
4- Dashbird's email alert for Configuration Errors.
Lambda Cost Monitoring with Dashbird
Dashbird not only helps us monitoring the errors with our serverless systems but also keeps us updated with the cost of operating our infrastructure.
- Within our account on the Dashboard, there's a dedicated section to the total cost incurred by our system over a duration of time. Similarly, in the Inventory module, we can separately see for each of our resources the cost of operating that resource.
- In the Alarms module, we can also set up an alarm for a given resource to notify us when the cost is above a certain threshold.
Note --- since I have AWS free tier so my total costs are $0 for now.
1- Monitoring Lambda Costs.
2- Monitoring Lambda Costs.
Dashbird Alarms
"Alarms" is a dedicated module by Dashbird to help us create custom alarms for our resources based on some metrics related to that resource. This significantly improves the MTTD/R. Creating an alarm is simple enough:
- From the navbar on the left click on "Alarms", then click on "New Alarm" and select "Lambda" or any other resource you would like to create an alarm for.
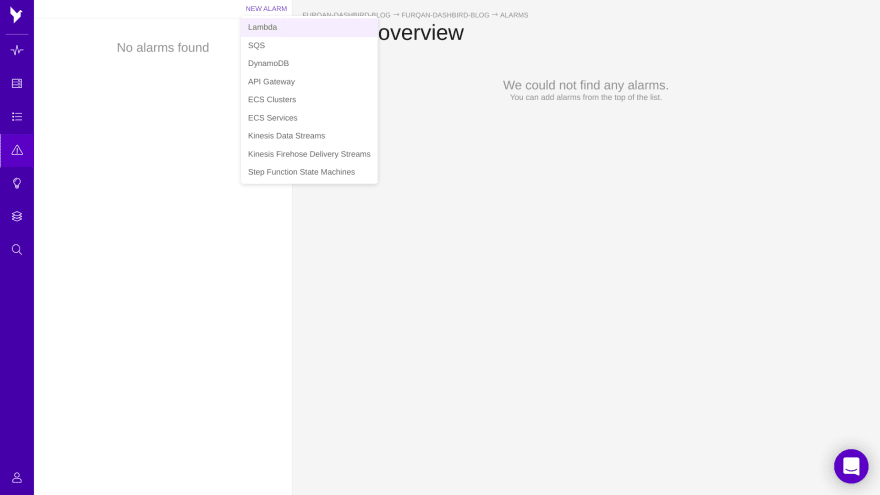
1- Setting up Alarms for Lambda
- We can create two types of alarms, critical or warning. Next, we select the metric on which we want the alarm to trigger this could be errors/cold starts/retry/invocations count, throttled count, execution or billed duration, memory used, cost incurred, or concurrent lambda executions.
- After selecting the metric we specify when the alarm triggers i.e. when the selected metric is above/below a specific threshold(5,10,20) on average/max/min/sum for the duration of time in minutes, hours or days. Finally, we select one or more target resources for which we want the alarm to be set.
- For example, I created an alarm for my lambda function to be triggered when*the error count is above 10 on average over the last 15 minutes*.
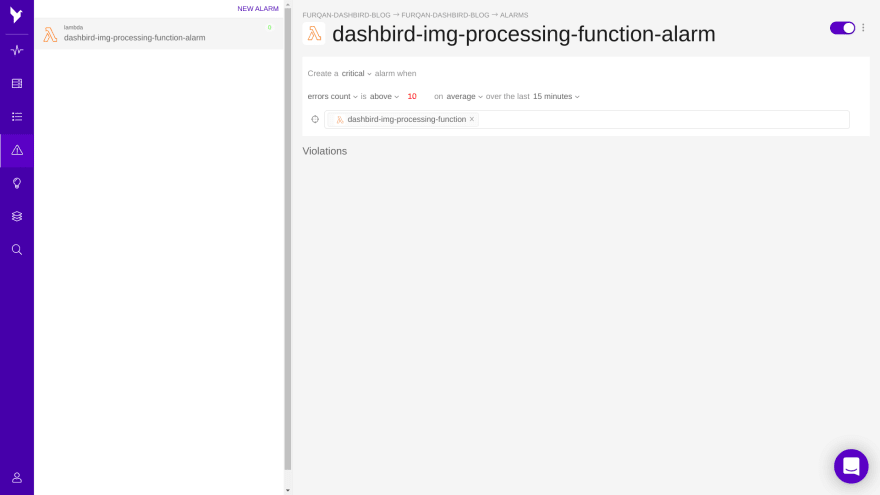
Dashbird Lambda Alarms.
- We can set up multiple alarms for our resources based on the metrics we want to monitor and with the help of Dashbird, increase the monitoring and troubleshooting capabilities of our systems.
Advanced troubleshooting with Dashbird's Log Search Module
A very cool feature in Dashbird that I would like to lastly discuss is its* Log Search *module. This module allows us to do some advanced-level search on all our logs helping us to efficiently filter out the logs that are of value to us.
- We can search through all our resources or can select a few resources whose logs we want to filter out.
- We can search for a specific keyword that we are interested in and all the matching results are accordingly filtered. For example, as can be seen below I filtered through all my resources to search for logs containing the keyword "MemoryError" and all corresponding results were filtered out.
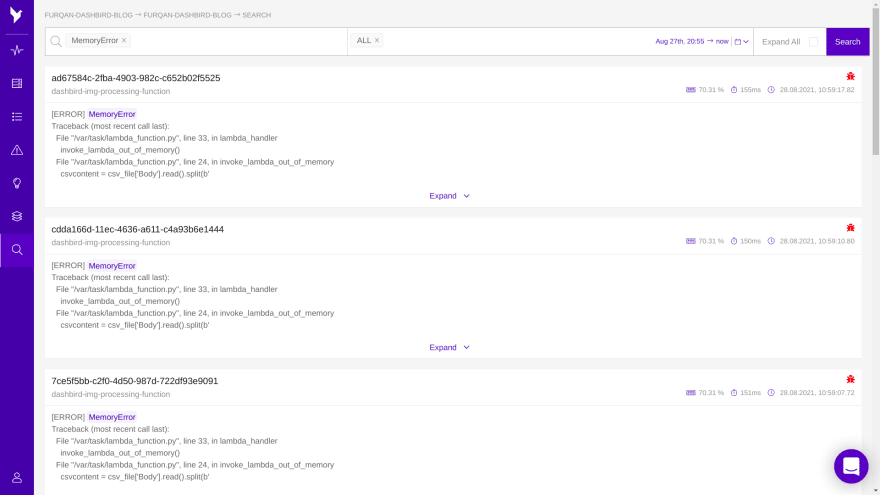
Dashbird Log Search Module.
Further reading:
Building complex Well-Architected serverless applications

Top comments (0)