
INTRODUCTION
Because users judge their experience based on the entire time they spend using an app, the performance of an app is never a single number and neither is it just about how fast your app loads. Hence, interactivity and responsiveness are also critical aspects that should not be overlooked.
To help us determine if the experience of our users is good or not, not only just in terms of fast load times but also interactivity and other aspects valuable to the user, we have: user-centric performance metrics.
WHAT ARE THEY?
Simply put, User-Centric Performance Metrics are those performance metrics that show us how users perceive our applications by measuring what affect user experience the most.
But are user-centric metrics all that we have? No.
We had the traditional metrics way before.
TRADITIONAL VS USER CENTRIC METRICS
| TRADITIONAL METRICS | USER-CENTRIC METRICS |
|---|---|
| DOMContentLoaded (DCL) | First Paint (FP) |
| Page Load (L) | First Contentful Paint (FCP) |
| First Meaningful Paint (FMP) | |
| Largest Contentful Paint (LCP) | |
| Time To Interactive (TTI) |
Although traditional metrics are available and can be used to (somehow) measure performance, they don't provide much information about the user's experience.
On the other hand, user-centric performance metrics provide an easier, more streamlined means of finding out:
- How fast initial content is loaded,
- When the user can start interacting with a web page,
- How soon can a web page respond to user interaction,
- How fast content is loaded on the page and so on.
Now, let's look at the user-centric metrics one at a time
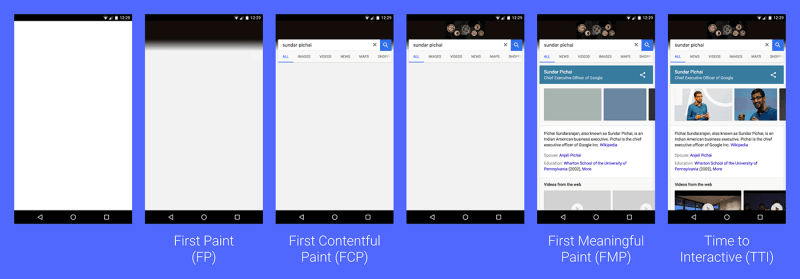
FIRST PAINT (FP)
This metric lets us know at what point in time elements are first rendered on the page. This is usually the frame after the initial state of a web page (blank screen). In PWAs, this is usually the skeleton screen we see before critical content is loaded.
FIRST CONTENTFUL PAINT (FCP)
This indicates when content is first rendered on the page. This content is not necessarily text only but any DOM element such as images, canvas or svgs.
FIRST MEANINGFUL PAINT (FMP)
FMP shows us the point when there is enough content on the page for the user to start consuming. Usually, it indicates when Hero Elements (important elements of the web page) are loaded onto the page e.g header section of the page.
LARGEST CONTENTFUL PAINT (LCP)
LCP indicates the point on the timeline where the largest chunk of content was rendered on the page.
TIME TO INTERACTIVE (TTI)
This metric lets us know when the page is completely usable and can respond to any user action.
Below is an image that shows these metrics and what they mean in the timeline of a web page.
CHECKING THEM OUT
To check these metrics for your web page, follow the steps below:
- Enter the URL to the web page,
- Open Chrome DevTools (CMD + ALT + I on Mac) or (CTRL + SHIFT + I on Windows),
- Open the Performance tab,
- Click on the Reload button for DevTools to start profiling the web page.
After DevTools is done profiling, you will be shown a timeline with markers indicating the metrics.
Below is the result of going through the above steps on AliExpress.

By clicking on any of the metrics, we see more information about it.
FIRST PAINT
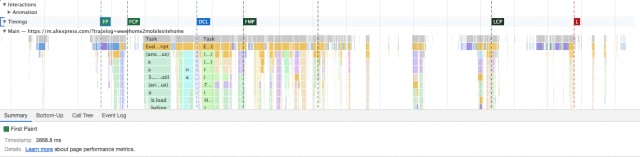
Here, we see that it took 3868.8ms (approximately 4s) for elements to first be rendered onto the page (First Paint metric).
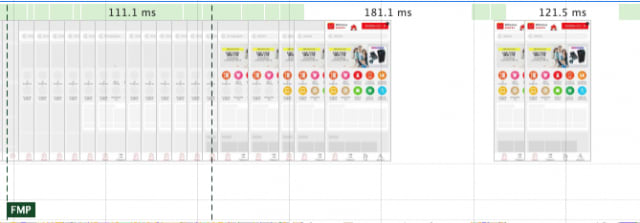
Zooming in, we can see what frame was rendered at First Paint.

On closer observation, we notice First Paint was the skeleton of the page.
We could also check for the other metrics.
FIRST CONTENTFUL PAINT
The First Contentful Paint metric shows when the first content (the tab element) is rendered.

FIRST MEANINGFUL PAINT
LARGEST CONTENTFUL PAINT

Clicking on the LCP marker, we notice it shows a little bit more information than the other metrics.

It indicates the size and type of content that was rendered and the related node. Hovering over RelatedNode, Chrome highlights the node for us and clicking takes us directly to the node in the Elements tab on DevTools.

Hovering over RelatedNode

Clicking RelatedNode
CONCLUSION
Knowing about these metrics can greatly help in improving user experience on the web.
In another post, I will explain how to optimise these metrics for your web page when you're not satisfied with it's performance.
LINK TO PREVIOUS POST: The Web Should Be F.I.R.E


Top comments (0)