
In the last two ducklings, I finished the extensive discussion on breakpoints and switched my focus to the watch area. In it, we have several amazing and lesser known tools that let us build insight into our running application. Being able to tell at a glance if something works correctly is crucial for many applications.
This is very important for collections and arrays. We can have thousands or millions of elements within a collection. Debugging this is very difficult without some basic tools.


 Shai Almog@debugagent
 🦆 Duckling the 8th:
Debug collections of elements 💪
Did you know you can filter collections & arrays in the watch?
See just the "good stuff"!
Did you use the Stream Debugger built into IntelliJ?
It's amazing and people don't know about it...
#CodeNewbie #140SecondDucklings13:07 PM - 28 Mar 2022


 Shai Almog@debugagent🦆 Duckling the 9th:
How do you display exactly what you need directly in the watch area?
How do you make sure it doesn't choke your performance?
Spring Boot JPA users... Check this one out...
#CodeNewbie #140SecondDucklings14:58 PM - 05 Apr 2022
Collections, Arrays and Streams
Debugging collections (lists, maps etc.) and arrays is painful. You need to dig through results or place conditional breakpoints in for loops. That’s all painful. There are better solutions…
Filtering Collections
I talked about a different type of filters a couple of weeks ago, so please don’t confuse the two. There are many filter types. Here, they apply to the collections and arrays.
This is a minor feature that’s actually on by default. Yet most developers don’t even notice it. When you expand an array of objects, you might have noticed that the IDE hides null values. This is a filter that’s on by default, you can also add your own…

We can start by selecting an array or collection in the watch and right clicking it. Then clicking the “Filter” option.

We can then input any condition we want where “this” stands for the current element. When we press enter, the filter will be applied and we’ll only see the applicable elements. Notice that in this case, I used method calls and their results as part of the filter.

Here we see the filter in action. We can clear it by pressing the “clear” button next to it. We can edit it by clicking on it too.
Stream Debugger
While I use the Java 8 stream API frequently, I still prefer the old for loops for most cases. The reason for this is debugging. Loops are just inherently easier to debug. It doesn’t mean we can’t debug streams, but it’s often more challenging and requires more wiggling.
JetBrains understood that problem and introduced the stream debugger, initially as a plugin and currently as a built-in tool in the IDE. You can see the button to launch the stream debugger when the current breakpoint is stopped on a stream.

When you press this button, the stream debugger is launched. It’s one tool where watching the video will probably explain it better, but I’ll try…
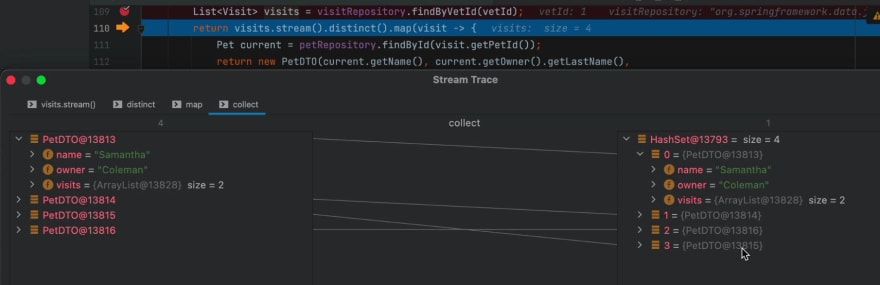
This tool represents every stream function as a stage. You can go back and forth between the stages where you can see how elements in one stage map to their counterparts in the next stage. E.g. a map operation can convert the type of element to a new type. So you would see the elements before the mapping and an arrow to the post mapping instance.
Notice that all the elements are “live” and you can inspect everything as you can with normal inspection in the watch.
Renderers
We normally look at elements in the watch area without giving it too much thought. That’s the “object” or the data…
But what we see is the way a renderer interprets the data. The default behavior for renders in Java is to invoke the toString() method. So while customizing this helps, there’s a lot more that a good renderer can accomplish…
In fact, next week's duckling will dig even deeper into this subject.
Mute Renderers to Speed Up Debugging
Don’t you just hate unresponsive debugging?
Pressing step over and just waiting forever for something to happen is very frustrating.
There are many reasons a debugger can be slow. Some of them relate to the application we’re debugging, but quite a few of them relate to features we turn on/off. Renderers fall into this category. They can be VERY expensive when we have many watch elements or if the process for rendering them is slow.

Luckily JetBrains provides a simple workaround: mute renderers. You can enable this by right clicking on the watch area.

Once we mute the renderers, they appear as a short form rendering. Just the object ID next to a button. Clicking on this entry automatically performs the rendering lazily. In this case, the rendering will just invoke the toString() method, as indicated here.

Once clicked, we can see the correct value in the renderer and we can inspect the result only for this value. Other values might still be “unrendered”.
Renderer Customization
toString() is great for many things, but it might not represent what we want to know about an object. Especially 3rd party objects where we can’t control the toString() implementation for cases where performance is an issue. toString() must be efficient since we might use it when logging an object in production. We can’t overburden it with data.

The “Customize Data Views…” menu item launches the renderer customization menu. This is a pretty powerful feature that lets us control many nuanced capabilities in the default renderer.

There are many options in this dialog that let you customize the way elements are rendered in the watch. One of my favorite options is the one to show hex values for integers, which is pretty useful for some of the low level stuff I do.
Here you can uncheck the hide null elements in arrays and collections option we discussed in the filter section above. You can also limit the toString() behavior to specific objects.
Type Renderer
For simple cases, toString() works really well. But there are complex cases where our ability to affect the rendering logic can make a vast difference. Case in point, Spring Boots JPA Repositories. These are interfaces that abstract the underlying database as a set of CRUD operations. A detailed toString() method will be expensive. It can trigger SQL queries, which isn’t something we’d want to do normally.
But when we debug, this might be pretty valuable.

First off, we need to select the right type for renderer. Notice you can use a base type to select the appropriate objects. In this case, JpaRepository is the base interface. By using the expression:
"JPA Repository with " + count() + " elements"
We effectively invoke the count() method on the object that’s rendered. This will probably result in an SQL call to the underlying database, but that might be performant enough during regular debugging.
Notice we can check the “On-demand” flag to make the rendering behave similarly to muted renderers, so it will only render on click.
For elements that support expanding, we can use additional expressions to fetch the full set of data. Here, I use findAll() to list the elements that IntelliJ will show upon expansion. I also use count() > 0 to indicate that the list is expandable.
As you can see, the top repository is a JPA repository. The one below isn’t. The top repository is easy to understand at a glance and we can inspect every element in the database instantly. That’s remarkably powerful!
Notice that the video above doesn’t yet cover the last portion here. I ran out of time there. Next week’s video will cover that and an additional interesting renderer feature.
Summary
Showing the right information in the watch is crucial. We can get a sense of what’s going on in an instant!
Debugging can fail over stupid things:
- Too much information
- Too little information
- Information we need to dig through deep hierarchies to find
We can resolve these things with the techniques I discuss above. If you get your watch section in order, your debugging sessions will become far more fluent.
In the next installment, I will teach you how to make the debugging sessions of your entire team more fluent…


Top comments (0)