Least squares method — explanation with example
Linear regression is simple and commonly used modeling approach and I already wrote about different ones (Simple Linear Regression, Multiple Linear Regression, Polynomial Linear Regression). But how does each decide what function is the best? For that, these regressions use least squares method. Very simple mathematical procedure which I will describe in this post.

Choosing regression type
When using linear regression, first step is choosing regression type. Do we want to use simple, multiple or polynomial? For simplicity, I will just use simple linear one. This means we have one input variable to predict new one. Example would be apartment price based on its size.
Linear equation has following form:
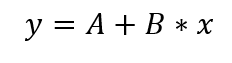
X is input variable and A and B are coefficients. Least squares method procedure is what we use to define best values for those coefficients.
Introduction
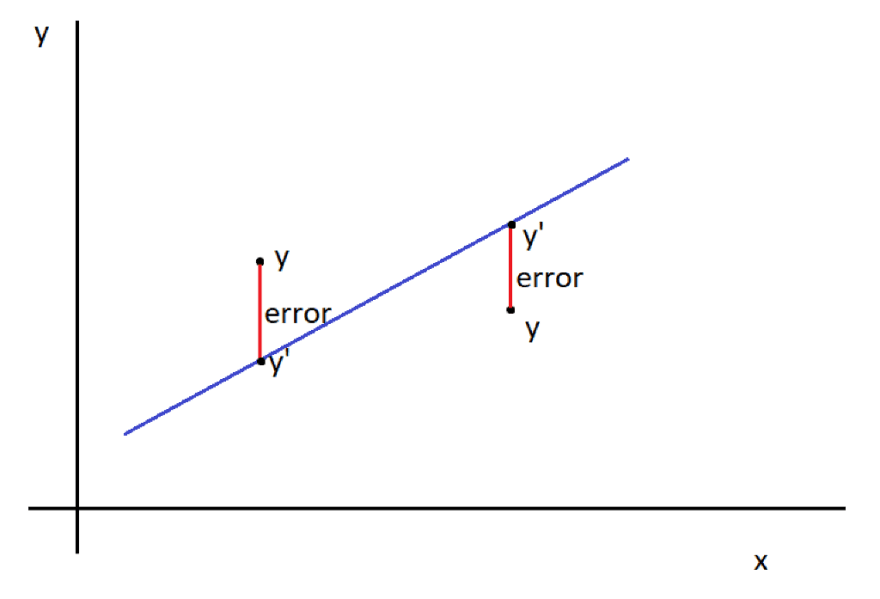
We could choose some random values for those coefficients. But some are better than others. So how this method helps us define best ones? Let’s say we have data for ten samples. We take those 10 samples and use them in function with those random coefficients. Logically, results we get from our function most probably will differ from sample results. We can calculate how much it exactly differs by calculating difference between value we get from our function and actual value from our dataset. But that is not enough. Some point will differ more, some less. First, we will square all those differences. Like this we make all those values positive. Then we will sum them. This final value is what indicates which coefficients pair is better. More specific, lower the value is, better coefficient values are.
Mathematical expression
Following equation can be used to calculate squares error:
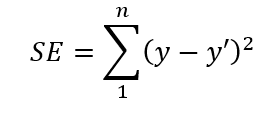
In this equation n is number of samples. Sample value is y, and y’ s predicted value.
Example
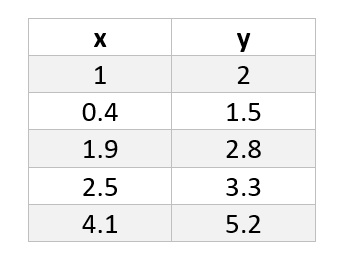
This all might be a bit too much to understand, so now, lets use this small example to show how it works. We could have following dataset:
We could also use following two functions to evaluate which one is better suited for our dataset:
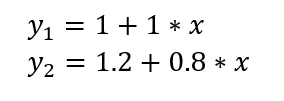
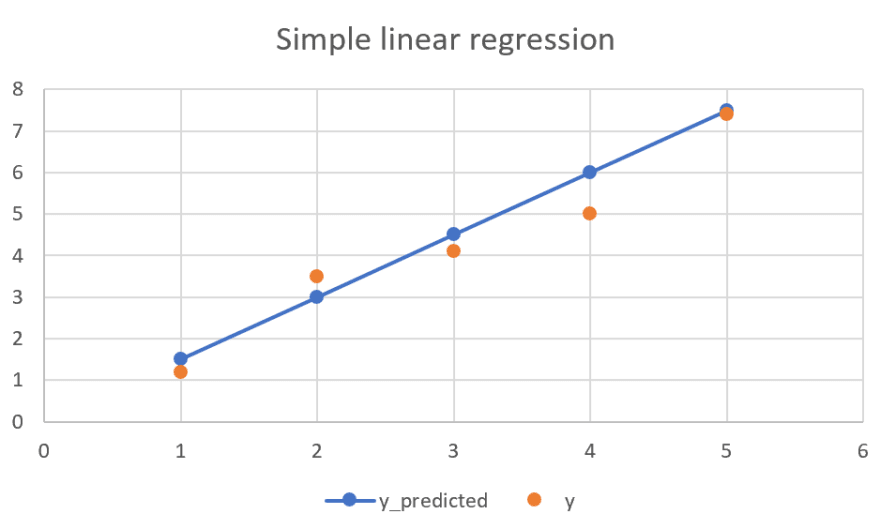
Chart below shows those points and functions visualized where each point is marked with red, function y1 is black line and green line is function y2.
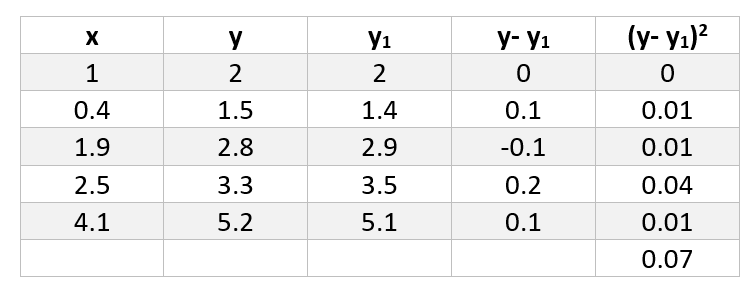
Now that we have train dataset and functions to evaluate, we can calculate differences and squares. For first function those values are:
Second function values are:

What we can read from these two tables is that calculated value for function y1 is 0.07 and for function y2 is 0.0168. Earlier, I wrote that smaller value means better fitting function, this means that function y2 is better option for our dataset.
Wrap up
Linear regression is widely used method and underneath uses least squares method. While this post might be mathematically heavier, I do hope it explained what least squares method is and how it works in a simple enough way. With all libraries today, it is very low chance you will ever need to do this manually. In Python, if you use sklearn library you would use only LinearRegression or other similar objects which will do this for you. However, it is always good to know what is happening during whole process and I do hope this post helped with that.

Top comments (0)