In this post, I will introduce Davraz, a software I created. Firstly, it is deployed on https://canbax.github.io/davraz/. So you can see it in action now.
This post aims to introduce graph visualization to non-technical people.
Introduction
Davraz is a graph database visualizer. Currently it supports only TigerGraph and Neo4j.
Background
I created Davraz for TigerGraph 2020 Graphathon. (It got 1st Place Reward YAAAY!) It is a tool for visualizing your TigerGraph and Neo4j databases. TigerGraph and Neo4j are graph databases. Usually, data is stored in SQL databases. Graph databases are a fairly new way to store data.
Why Graph Database?
In SQL databases, if your data is highly connected, querying data might be time-consuming (due to join operations). In this case, using a graph database might considerably decrease execution time. This depends on how the graph database is implemented at its core. Creating index in SQL database will also help you execute faster. At its core, creating an index is actually like creating a graph data structure. So we can say SQL is also benefiting from graphs for faster execution.
Why Graph Visualization?
Visualizing data is one of the most effective ways of understanding data. Graphs are a pretty generic data structure and almost any data can be defined as a graph. So visualizing graphs can be a very generic and effective way to understand any data. Graph visualization can be used for insightful analysis and interpretation.

Set-up for TigerGraph
From https://tgcloud.io/ you can jump-start creating your own free TigerGraph database. It is very easy, you just need to click "next" etc... But you can find more guidance on the Internet. For visualization, you can also use their embedded system called "Graph Studio".
After you have a running TigerGraph instance, you can start visualizing it on Davraz. If you open https://canbax.github.io/davraz/, at first you should enter database configuration data. 
You need to provide "Database URL", "Graph Name", "Database username", and "Database password" fields. After that, if you click to "Generate Token" button, you are ready to go.
You do NOT need to change "Proxy Server URL" if you don't want to use your own proxy.
If your "Database URL" is wrong or if the TigerGraph instance is not active, you might get an error like the below 
You might get errors like the below if you don't provide the correct username, password, or graph name.


If there is no error, you are good to GO! Below is a video showing how it works. Also, note that certain operations might require "database secret". So you should provide or generate the secret of your TigerGraph database as well.
Also, note that the proxy server (https://tiger-api.herokuapp.com/) might be down for some reason. (It is a free instance) So just refreshing it might help in some cases.
Set-up for Neo4j
If you use Davraz from the GitHub deployment (https://canbax.github.io/davraz/), you need to serve your Neo4j API from HTTPS. This is because you cannot communicate with an HTTP server from an HTTPS server. Setting up an HTTPS server and setting up the SSL policy seems a bit tedious for me. For this reason, I will run a local version of Davraz on my own machine with HTTP. And also a local Neo4j server again from my own machine with HTTP. Inside Neo4j settings, I set dbms.security.auth_enabled=false so I can make HTTP requests and get a response without providing any username and password.
Below are my settings to connect to my local Neo4j instance. The database URL is http://localhost:7474/db/data/transaction/commit. Username and password are not necessary, they can be empty.

From below video, you can see how you can visualize Neo4j data.
Here you might see a strange view if the styles are not the default styles. See the below image for example. 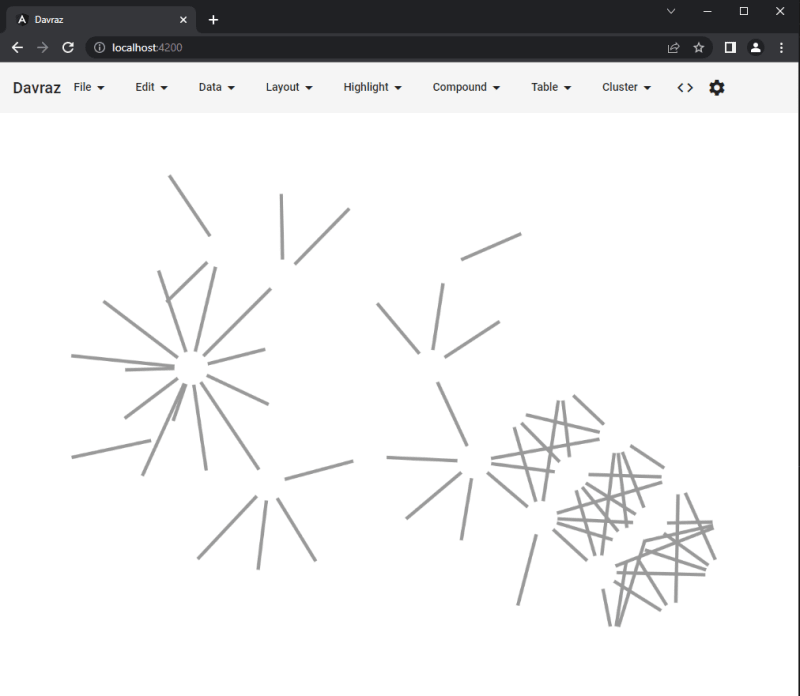
To use default graph styles, you can click to "File">"Clear Graph Style".
Like TigerGraph, Neo4j also provides free cloud instances. Neo4j AuraDB looks very cool and nice as well. Up to 50k nodes and 175k edges, it is free. Also, it has a nice visualizer called "Bloom".
Features
From "File" menu, you can save a graph as JSON file, load back from the file. You can save only the selected elements. You can export graph as an image. You can load different graph styles.
From "Edit" menu, you can delete selected elements, hide selected elements, show all the previously hidden elements and observe a history of graph states.
From "Data" menu, you can clear all the data or bring a sample data.
From "Layout" menu, you can run an incremental or randomized layout. There are many different layout types but the default is fCoSE algorithm.
From "Highlight" menu, elements can be emphasized to distinguish from others.
From "Compound" menu, compound elements can be created or removed.
From "Table" menu, whole data or a part of the existing data can be shown as table(s).
From "Cluster" menu, you can run "Markov Clustering" algorithm or cluster degree-1 nodes.


Top comments (0)