Wouldn't it be nice to have your infrastructure GCP billing along with with your infrastructure monitoring dashboard?
Let's get started!
Export GCP Billing to BigQuery
Reference: https://cloud.google.com/billing/docs/how-to/export-data-bigquery
Summarized Steps
- Create a BigQuery data set. GCP will save the Billing data here.

- Go to Billing console and configure the Billing export.


BigQuery
First, let's ensure that the billing data are already exported.
Let's say we want to know how much cost was incurred per service from April 1, 2020. The SQL query would be this.
SELECT service.description as service, currency, sum(cost) AS cost
FROM `DATASET_NAME.gcp_billing_export_v1_*`
WHERE usage_start_time >= "2020-04-01 00:00:00 UTC"
GROUP BY service, currency
ORDER BY cost DESC
Example result

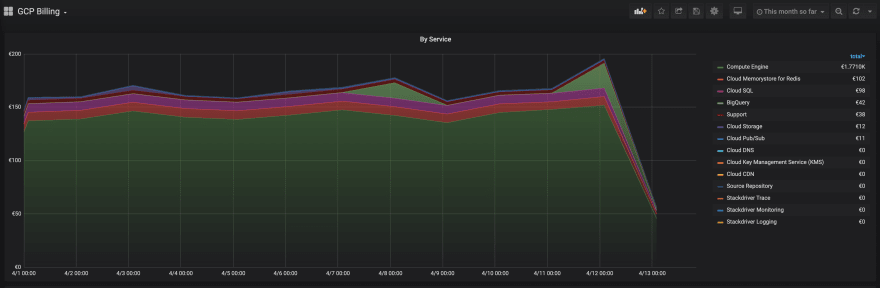
Grafana
Finally, use the example configuration to visualize the query in Grafana.

This is the equivalent query.
SELECT $__timeGroupAlias(usage_start_time, 1d),
  service.description AS metric,
  sum(cost) AS cost
FROM `DATASET_NAME.gcp_billing_export_v1_*`
WHERE $__timeFilter(usage_start_time)
GROUP BY 1, 2
ORDER BY 1, 2
-
$__timeGroupAliasand$__timeFilterare Grafana SQL macros. - The column that is aliased as
metricwill be the labels to be shown and grouped in the graph.
The End
Any question? Let me know in the comments section!
Thanks for reading!

Top comments (2)
This article saved me another 10 hours of trying to get this to work.
Bryan, you are a beautiful soul. I hope you live up to 160, in the body of a 20-year-old, in a permanent nirvana state.
Great post! Thanks!