
Purpose
The importance of understanding the implications of being an informed voter is profound. The ability for citizens of a country to understand the financial spending of candidates running for office (at any level—presidential, state, or local) allows one to understand where a candidate's priorities lie. Observing and analyzing financial trends allows one to make predictions about who may win a particular election. A lot of the time, however, it’s easy to get lost in the numbers!
Thus, being able to visualize this data helps in comparing and understanding the financial spending of candidates. However, how do you verify that the graphs you see online are indeed accurate?
It’s a catch-22 situation! Either you receive accurate numbers (hard to analyze) or potentially biased graphs. In this tutorial, you’ll learn how to make the graph yourself, using the official financial data available at the OpenFEC API.
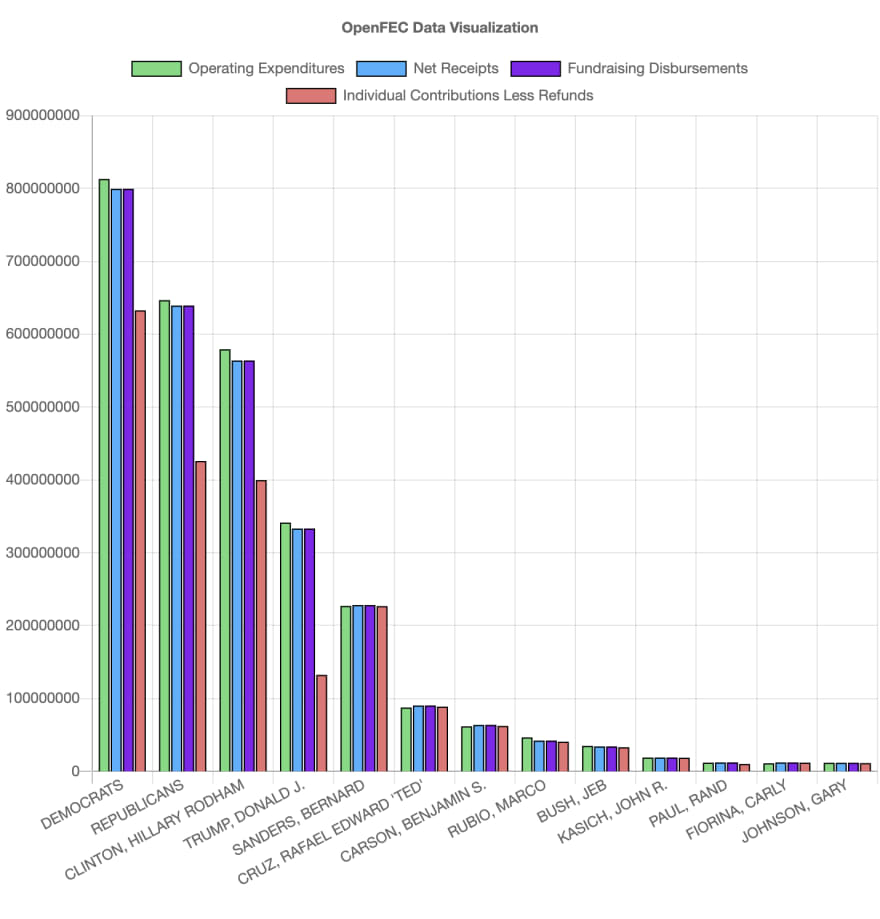
For this tutorial, we’ll walk through how to make a bar graph visualizing various financial information (operating expenses, net receipts, fundraising disbursements, and individual contribution less refunds) for Democrats and Republicans as a whole, as well as specific candidates, for the 2016 presidential election.
Setup
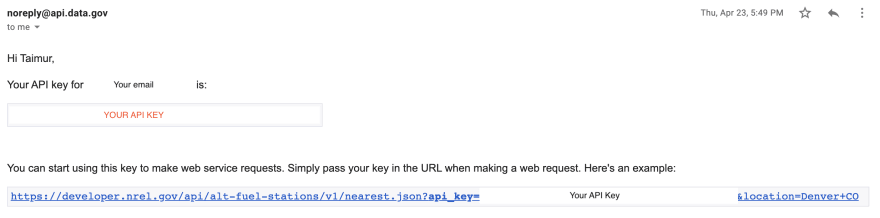
Sign up for an OpenFEC API Key at https://api.data.gov/signup/. This is a government website with the most up-to-date financial information. You'll see a form like this:

Check your email for the API Key and save it
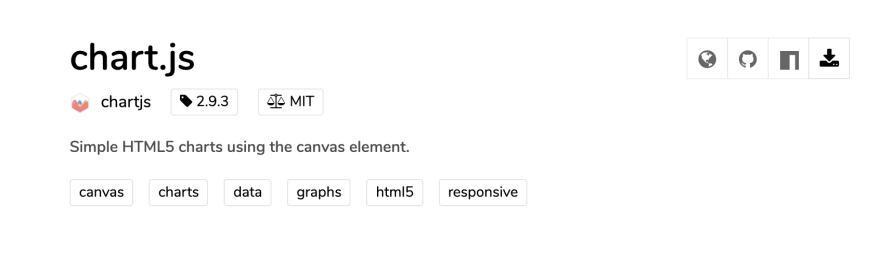
Download ChartJS here. This is done by clicking the download icon (fourth button on the right), which will download a zip file. Once the zip file is downloaded, extract it to the desired location where you will store all your project files.
Create one empty HTML file (call it
OpenFEC.html) and one empty JavaScript file (call itOpenFEC.js) and save these files in the same location as the ChartJS files you downloaded in step 3.Download a text editor (we like Sublime) or an IDE (we prefer Brackets for any HTML/CSS/JavaScript project) if you don’t have one. You'll need one to code everything up!
At any stage of this tutorial, right-click on the HTML file and open it with your favorite web browser to see the output!

Coding!
Now that you have the ChartJS dependency and the HTML (OpenFEC.html) and JavaScript (OpenFEC.js) files set up, let’s get to coding!
Coding our HTML File
In OpenFEC.html, add the following lines of code.
<!-- Create a canvas object for ChartJS -->
<canvas id="chart" width="400" height="400"></canvas>
This line is used to create a canvas (needed for ChartJS) with the specified width and height. This is where our graph will go on the webpage!
<!-- Point the HTML file to Chart.js -->
<script src = "./package/dist/Chart.js"> </script>
This line points our HTML file to the ChartJS JavaScript file that was in the zip file we extracted earlier (step 3 of the setup).
<!-- Point the HTML file to our JS file -->
<script src = "./OpenFEC.js"></script>
Our last HTML code line points the HTML file to our personal JavaScript file (OpenFEC.js), which is where we will do all of our coding to retrieve the information and display the graph. That's it for the HTML file!
Using the API
Before we start on the JavaScript file, let’s understand the API request we will make.
Getting a Request URL
Go to https://api.open.fec.gov/developers/ and scroll down and click on the presidential tab.

This should open up a drop down with many options of the different types of information you can obtain. For our purposes, choose the tab seen below.

This should now populate your screen with a description of the information available for this specific request, as well as certain parameters you can use to filter this information. There is an immense amount of information available on this website and you can specify what information you want by playing around with the parameters and with different tabs (presidential is just one!). For now, click the Try it out button and enter the following parameters.
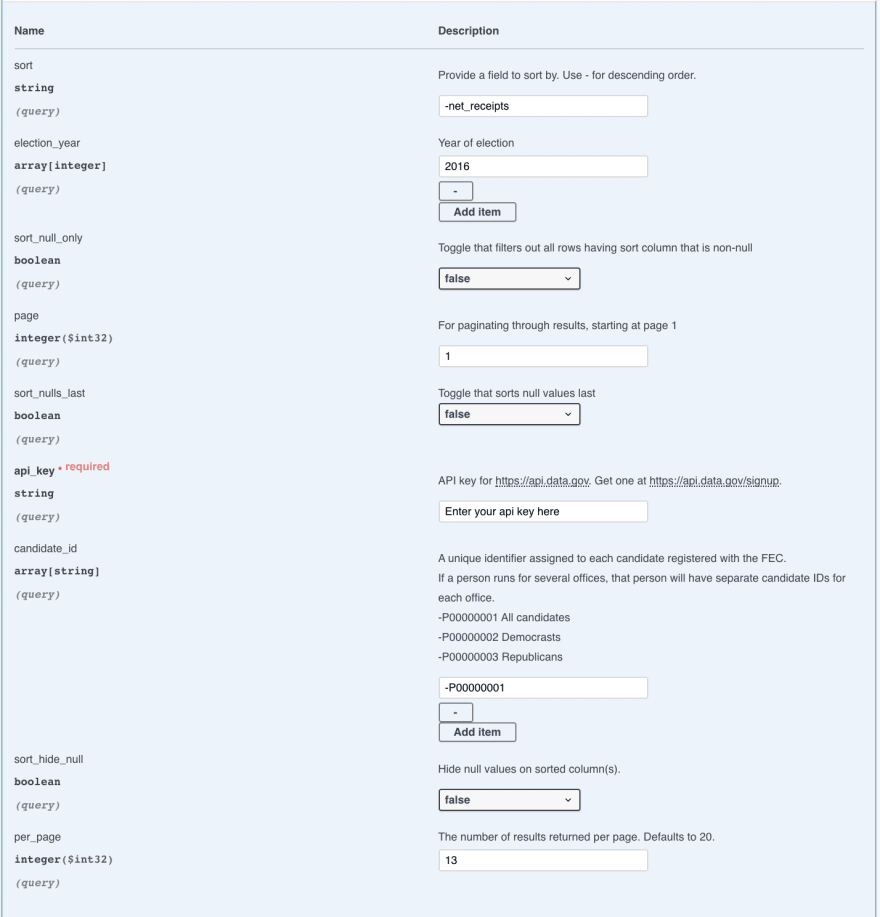
As you can see from this, we are filtering our financial information to focus on all candidates (-P00000001) from the 2016 presidential election, organized by decreasing order of net receipts. There will be multiple pages returned, but we want to focus solely on the first 13 results, so we set the per_page parameter to 13. Before actually getting the results, however, we must also enter the unique API key we signed up for earlier!
Next, hit the execute button. You should get a response that has a box labeled Request URL and looks like this (note the API key has been colored out).
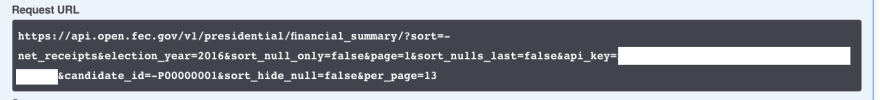
Copy and paste this link into any web browser.
Woah! You should’ve been hit with a big wall of text! What does this all mean?!
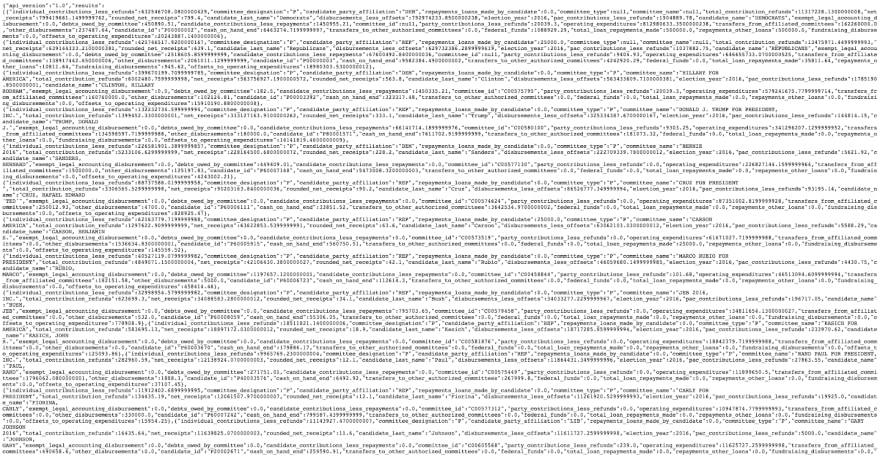
JSON (and Beautifying It)
What you received is a JSON (JavaScript Object Notation) response after making an API GET request. Essentially, this is the raw format of all the information you "got" from OpenFEC. To make it more readable, copy and paste all the text and enter it into a JSON beautifier (https://codebeautify.org/jsonviewer) and hit Beautify.
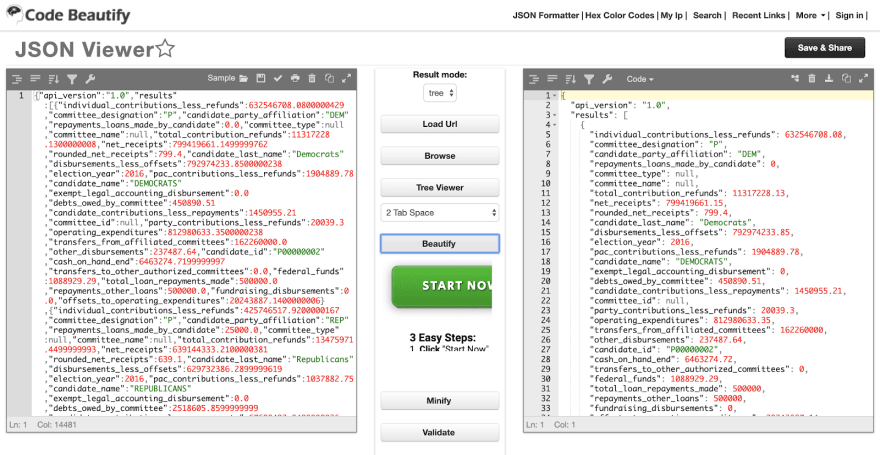
Now, that’s much easier to read! As you can see, everything is in key-value pairs. For example, there is a key net_receipts and a value 799419661.15 associated with it. Scroll through the JSON on the right of your screen to see what other information you have found.
There are few important things to note about JSON. Text surrounded by curly braces indicate a JSON object. Text surrounded by square brackets are elements of an array (an array is synonymous for a list).
You should notice that there is a results key whose value is an array (i.e. list) of multiple JSON objects (many key-value pairs grouped by curly braces). Each JSON object has various information (key-value pairs) for different candidates/parties!
Great, now we have our information! But, how do we get this information into the code?
Coding Our JavaScript File
XMLHttpRequest
Let’s open our JS file and enter the following lines of code. The link will be the Request URL we got from the OpenFEC website (where the code says YOUR API KEY, make sure to enter your unique API key).
// Create a web request object using an XMLHttpRequest object
var http = new XMLHttpRequest();

// This is the url we are making the request to
var url = "https://api.open.fec.gov/v1/presidential/financial_summary/"
\+ "?sort=-net_receipts&election_year=2016&sort_null_only=false&page=1&sort_nulls_last=false"
\+ "&api_key=YOUR API KEY HERE&candidate_id=-P00000001&sort_hide_null=false&per_page=13";
XMLHttpRequest is used to create a JavaScript Object which we can use to make a request to the internet! Now, enter the following code:
// open and sending the GET request at the url
http.open('GET', url);
http.send();
This allows us to open a GET request (we want to "GET" information from the webpage) to our specified URL. We then send the request! Note that GET is not the only type of HTTP request, but we won't concern ourselves with the other types of requests here.
Now that we have made our request, we need to set up the onreadystatechange function, which will be invoked when we receive a response. We also need to verify that the response we received is valid (this.readyState == 4 and this.status == 200) before we start using the information we receive from the request. You can learn more about the different HTTP status codes here.
// this function will run when we receive a response
http.onreadystatechange=function(){
  // only proceed once we receive a VALID response
  if (this.readyState == 4 && this.status == 200) {
Extracting the Data
Now, we have to extract the data from the response we received from the request. This is done by JSON.parse(this.response), which takes the response we received and parses it into a JavaScript Object (raw_data) that we can use. We then want to focus on the information available under the results key from the API response, so we index our raw_data by the key "results".
// obtain all the JSON data and parse it into a JavaScript object raw_data
    var raw_data = JSON.parse(this.response);
    // obtain the results array from the raw_data
    var results = raw_data["results"];
Now that we have our results saved in the results array our work is almost done! results stores all the JSON objects of each respective candidate/party with all their financial information.
To set up for ChartJS (which will be discussed later), we want to get all our candidate/party names in an array and each of our data categories (operating expenditures, net receipts, fundraising disbursements, and individual contributions less refunds) into distinct arrays. This is done as follows.
// initialize empty arrays for the fields we are interested in displaying in our chart
        names = [];
        operating_expenditures = [];
        total_contribution_refunds = [];
        net_receipts = [];
        individual_contributions_less_refunds = [];
        fundraising_disbursements = [];

        // loop through all of the results
        for (i = 0; i < results.length; i++) {
            // obtain the current candidate / party from all the results we are traversing
            current_data = results[i];

            /* obtain the candidate name, operating expenditures, etc. by indexing the current_data with
               appropriate key */
            names.push(current_data["candidate_name"]);
            operating_expenditures.push(current_data["operating_expenditures"]);
            net_receipts.push(current_data["net_receipts"]);
            fundraising_disbursements.push(current_data["fundraising_disbursements"]);
            individual_contributions_less_refunds.push(current_data["individual_contributions_less_refunds"]);
        }
After initializing all our empty arrays, we loop through all of our results and save the current element (remember, the current element is a JSON object which has the information for a specific candidate/party). We then index this element by the keys associated with our desired information (see the API response shown earlier for the various keys) and push the information into the appropriate arrays. After doing this for every respective element of the results array, we have successfully saved all of the information that we desire from the API. Onto using the information in ChartJS!
ChartJS Bar Graph
Now that we have our data from the API integrated, we will be creating and customizing the graph.
Creating the Graph
To create the graph, we want to instantiate the chart by passing in the 2d context of the canvas where the chart will be drawn. We want to create a bar graph.
// Save the chart from HTML in JavaScript
        var ctx = document.getElementById('chart').getContext('2d');
        // Create a new Chart (will be a bar chart) object
        var chart = new Chart(ctx, {
        type: 'bar',
Customizing the Graph
Once we’ve instantiated it, we start customizing the graph. labels: names uses the names array we created earlier to ensure that the name of each candidate/party is on the x-axis of our graph. Once we’ve set the x-axis, we begin setting our data for each data category of interest (operating expenditures, net receipts, etc.). Each category will be one object in the datasets array. Each element of this datasets array will have attributes such as a label, an array which holds the desired data, and various aesthetic attributes. Since we already have arrays storing all of the different financial information desired, we can use those arrays as the values for the data attribute of the appropriate data category. For the aesthetic attributes involving colors, we can set the value as a general color (e.g. black, white, yellow) or a specific color (rgba(0, 0, 0, 0.1)). See https://www.hexcolortool.com/ to reference any color you desire!
Repeat this customization procedure for every data set you have.
data: {
            // x-axis will be labeled with names
            labels: names,
            /* create an array of different data values for each name, each having respective labels, colors,
               and data that we obtained from the API response earlier*/
            datasets: [
                {
                label: 'Operating Expenditures',
                data: operating_expenditures,
                backgroundColor: "rgba(106, 220, 123, 1)",
                borderColor: "black",
                borderWidth: 1
                    },
                    {
                label: "Net Receipts",
                data: net_receipts,
                backgroundColor: "rgba(71, 175, 255, 1)",
                borderColor: "black",
                borderWidth: 1,
                },
                {
                label: "Fundraising Disbursements",
                data: net_receipts,
                backgroundColor: "rgba(136, 0, 240, 1)",
                borderColor: "black",
                borderWidth: 1,
                },
                {
                label: "Individual Contributions Less Refunds",
                data: individual_contributions_less_refunds,
                backgroundColor: "rgba(233, 114, 114, 1)",
                borderColor: "black",
                borderWidth: 1,
                }
            ]
        },
Once you’re done labeling and customizing each data category, you can add options to create a title for the graph.
        // tinker with various options for the chart
        options: {
            // set a title
            title: {
                display: true,
                text: 'OpenFEC Data Visualization'
            }
        }
    });

    }
}
That's it! You've completed the coding!
Expected Output
Let's see how the graph looks! Save your OpenFEC.html and OpenFEC.js files. Look for OpenFEC.html in your file directory and right click it. Open the file with a web browser and it should look like below!
Conclusion
From this tutorial, you should have learned technical skills such as
- How to use the OpenFEC API to obtain desired information
- What JSON is
- How to make an API request from your JavaScript code using
XMLHttpRequestand how to extract information from the response - How to visualize data using ChartJS in order to make a bar chart
Moreover, in terms of themes, you should have learned
- The importance of using reliable financial data so that you can be an informed voter, make accurate predictions, and draw unbiased conclusions
- The importance of visualizing financial data so that you can see and analyze complex information in an easy to understand manner
While this example was simple, it served to illustrate the power of understanding how to use APIs to extract information and how to use this information to create your own charts. The variety of information you can explore even within one API and how you can visualize the information for trend analysis is an extremely powerful tool that helps in discovering a multitude of information.
Next Steps
As next steps, the reader is encouraged to
- Graph data comparing specific financial information from the 2016 election and 2020 election in order to find similarities and differences
- Explore coloring and other ChartJS features


Top comments (1)
JSON beautifier tools This is not bad too ^^
jsonformatting.com/