TL;DR: This post demonstrates how to connect PyTorch Lightning logging to Azure ML natively with ML Flow.
If you are new to Azure you can get started a free subscription using the link below.
Create your Azure free account today | Microsoft Azure
Azure ML and PyTorch Lighting
In my last post on the subject, I outlined the benefits of both PyTorch Lightning and Azure ML to simplify training deep learning models. If you haven’t yet check it out!
Training Your First Distributed PyTorch Lightning Model with Azure ML
Once you’ve trained your first distributed PyTorch Lighting model with Azure ML it is time to add logging.
Why do we care about logging?
Logs are critical for troubleshooting and tracking the performance of machine learning models. Since we often train on remote clusters, logs provide a simple mechanism for having a clear understanding of what’s going on at each phase of developing our model.
As opposed to simple print statements, logs are time stamped, can be filtered by severity, and are used by Azure ML to visualize critical metrics such during training, validation, and testing. Logging metrics with Azure ML is alos a perquisite for using the Azure ML HyperDrive Service to help us find optimal model configurations.
Tune hyperparameters for your model - Azure Machine Learning
Logging is a perfect demonstration of how both PyTorch Lighting and Azure ML combine to show simplify your model training just by using lightning we can save ourselves dozens of lines of PyTorch code in our application earning readability in the process.
Logging with PyTorch Lighting
In vanilla PyTorch, keeping track and maintaining logging code can get complicated very quickly.
ML frameworks and services such as Azure ML, Tensor Board, TestTube, Neptune.ai and Comet ML each have their own unique logging APIs. This means that ML engineers often need to maintain multiple log statements at each phase of training, validation and testing.
PyTorch Lighting simplifies this process by providing a unified logging interface that comes with out of the box support with the most popular machine learning logging APIs.
Loggers - PyTorch Lightning 1.0.2 documentation
Multiple Loggers can even be chained together which greatly simplifies your code.
**from** pytorch\_lightning.loggers **import** TensorBoardLogger, TestTubeLogger
logger1 **=** TensorBoardLogger('tb\_logs', name **=**'my\_model')
logger2 **=** TestTubeLogger('tb\_logs', name **=**'my\_model')
trainer **=** Trainer(logger **=** [logger1, logger2])
Once, loggers are provide to a PyTorch Lighting trainer they can be accessed in any lightning_module_function_or_hook outside of __init__.
**class**  **MyModule** (LightningModule):
**def**  **some\_lightning\_module\_function\_or\_hook** (self):
 some\_img **=** fake\_image()
_# Option 1_
 self **.** logger **.** experiment[0] **.** add\_image('generated\_images', some\_img, 0)
_# Option 2_
 self **.** logger[0] **.** experiment **.** add\_image('generated\_images', some\_img, 0)
Azure ML Logging with PyTorch Lighting with ML Flow
Since Azure ML has native integration with ML Flow, we can take advantage of PyTorch Lighting’s ML Flow Logger module to get native metric visualizations across multiple experiment runs and utilize hyperdrive with very minor changes to our training code.
Below I’ll outline the code needed to take advantage of Azure ML Logging with PyTorch lightning.
Step #1 Environment
Add PyTorch Lighting, Azure ML and ML Flow packages to the run environment.
pip
 - azureml-defaults
 - mlflow
 - azureml-mlflow
 - pytorch-lightning
Step #2 Get Azure ML Run Context and ML Flow Tracking URL
from azureml.core.run import Run

run = Run.get\_context()
mlflow\_url = run.experiment.workspace.get\_mlflow\_tracking\_uri()mlf\_logger =
Step #3 Initialize PyTorch Lighting MLFlow Logger and Link Run.id
MLFlowLogger(experiment\_name=amlexp.name, tracking\_uri=mlflow\_url)
mlf\_logger.\_run\_id = run.id
Step #4 Add logging statements to the PyTorch Lighting the training_step, validation_step, and test_step Hooks
def training\_step(self, batch, batch\_idx):

 # Calculate train loss here
 self.log("train\_loss", loss)
 # return test loss

def validation\_step(self, batch, batch\_idx):

 # Calculate validation loss here
 self.log("val\_loss", loss)
 # return test loss

def test\_step(self, batch, batch\_idx):
 # Calculate test loss here
 self.log("test\_loss", loss)
 # return test loss
Step #5 Add the ML Flow Logger to the PyTorch Lightning Trainer
trainer = pl.Trainer.from\_argparse\_args(args)

trainer.logger = mlf\_logger # enjoy default logging implemented by pl!
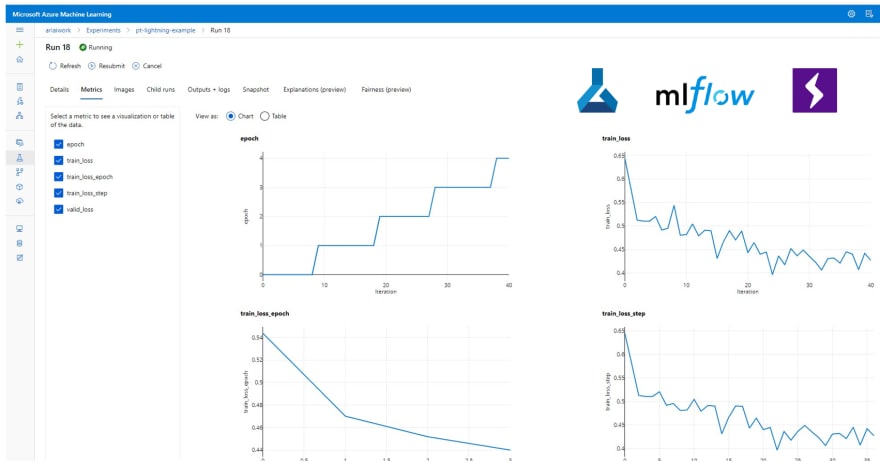
And there you have it! Now when you submit your PyTorch Lighting train script you will get real time visualizations and HyperDrive inputs at Train, Validation, and Test time with a fraction of the normal required code.
You shouldn’t but if you have any issues let me know in the comments.
Next Steps
In the next post, I will show you how to configure Multi Node Distributed Training with PyTorch and Azure ML using Low Priority compute instances to minimize training cost by an order of magnitude.
Plan and manage costs - Azure Machine Learning
Acknowledgements
I want to give a major shout out to Minna Xiao and Alex Deng from the Azure ML team for their support and commitment working towards a better developer experience with Open Source Frameworks such as PyTorch Lighting on Azure.
About the Author
Aaron (Ari) Bornstein is an AI researcher with a passion for history, engaging with new technologies and computational medicine. As an Open Source Engineer at Microsoft’s Cloud Developer Advocacy team, he collaborates with the Israeli Hi-Tech Community, to solve real world problems with game changing technologies that are then documented, open sourced, and shared with the rest of the world.


Top comments (0)