Opening Remarks
There were a couple of items I forgot to mention in Part 1: First, the scope of my research was limited to CloudWatch logs from Windows-based EC2 instances. Second, some deviations from existing documentation were made with the intent of leveraging other Splunk technical add-ons (TAs) in order to achieve a degree of data normalization. We will discuss these items in a bit more detail later.
Considerations
The Splunk Add-On for AWS allows Splunk to retrieve metrics and other data from an AWS account using API calls. Although we will be focusing on retrieving AWS CloudWatch logs, you may want to explore the other available options provided by the add-on. These other options may be of interest to your or your organization’s needs. Before we begin our journey, we’ll take a quick look at the strengths and weaknesses of the Splunk Add-On for AWS.
Strengths
- The Splunk Add-On for AWS is developed and supported by Splunk.
- As mentioned before, the Splunk Add-On for AWS provides the option of collecting other types of AWS resources like Billing, CloudTrail, S3, among others.
- Most of the configuration can be performed via the Splunk Web interface and the AWS management console.
- Since the Splunk Add-On for AWS uses API calls to retrieve logs, you likely will not require any additional firewall policies to allow inbound connections.
- Being a pull mechanism, the Splunk Add-On for AWS minimizes the risk of in-transit data loss.
(Potential) Weaknesses
- Splunk Cloud users may require Splunk support to install apps and add-ons or to apply certain configuration changes on their behalf.
- AWS has thresholds on API requests which could result in throttling when exceeded.
- The data inputs of the Splunk Add-On for AWS run on a scheduler. This means that the logs are not retrieved in real-time. Decreasing the wait time on the scheduler could result in API call throttling. Additional considerations may be required if the data being retrieved from AWS is also being used in time sensitive contexts such as Splunk Enterprise Security correlation searches.
- Splunk is said to be deprecating the option to pull AWS CloudWatch logs (and VPC flow logs) using the Splunk Add-On for AWS. Splunk recommends the use of Kinesis Firehose for these input types.
Let’s Get to Down to Business!
AWS Bill of Materials
I won’t be very descriptive here since AWS’s own documentation is quite detailed and easy to follow. I may come back and write my own guide on this later, but for now I will be outlining what you’ll need to have in AWS before we move onto Splunk:
- An AWS VPC
- One or more Windows EC2 instances in your VPC.
- IAM Roles for use with the CloudWatch Agent and deploy the CloudWatch agent using Systems Manager. I’ve included the CloudWatch Agent configuration template from my AWS System Manager Parameter Store. Note that I’ve specified separate log groups for each main type of Windows Event log: System, Security, and Application. This will give us a degree of granularity when it comes time to make our Windows events compliant with the Splunk CIM. I’ve also chosen to render Windows event logs using XML. This is just my preference, but XML logs appear to be smaller and therefore should result in a slight reduction in Splunk license utilization. Once the CloudWatch agent has been installed and configured, you should be able to see your log streams in CloudWatch > Logs > Log groups.
- An AWS user account with the appropriate permissions. To keeps thing simple, I used the policy template containing all permissions. Please make sure you save your user’s secret access key because you won’t be able to get it later. You can always delete and create a new pair of access keys if you missed the chance to save the initial set.
{
    "logs": {
        "logs_collected": {
            "windows_events": {
                "collect_list": [
                    {
                        "event_format": "xml",
                        "event_levels": [
                            "VERBOSE",
                            "INFORMATION",
                            "WARNING",
                            "ERROR",
                            "CRITICAL"
                        ],
                        "event_name": "System",
                        "log_group_name": "WindowsEventLogSystem",
                        "log_stream_name": "{instance_id}"
                    },
                    {
                        "event_format": "xml",
                        "event_levels": [
                            "VERBOSE",
                            "INFORMATION",
                            "WARNING",
                            "ERROR",
                            "CRITICAL"
                        ],
                        "event_name": "Security",
                        "log_group_name": "WindowsEventLogSecurity",
                        "log_stream_name": "{instance_id}"
                    },
                    {
                        "event_format": "xml",
                        "event_levels": [
                            "VERBOSE",
                            "INFORMATION",
                            "WARNING",
                            "ERROR",
                            "CRITICAL"
                        ],
                        "event_name": "Application",
                        "log_group_name": "WindowsEventLogApplication",
                        "log_stream_name": "{instance_id}"
                    }
                ]
            }
        }
    },
    "metrics": {
        "append_dimensions": {
            "AutoScalingGroupName": "${aws:AutoScalingGroupName}",
            "ImageId": "${aws:ImageId}",
            "InstanceId": "${aws:InstanceId}",
            "InstanceType": "${aws:InstanceType}"
        },
        "metrics_collected": {
            "LogicalDisk": {
                "measurement": [
                    "% Free Space"
                ],
                "metrics_collection_interval": 60,
                "resources": [
                    "*"
                ]
            },
            "Memory": {
                "measurement": [
                    "% Committed Bytes In Use"
                ],
                "metrics_collection_interval": 60
            },
            "Paging File": {
                "measurement": [
                    "% Usage"
                ],
                "metrics_collection_interval": 60,
                "resources": [
                    "*"
                ]
            },
            "PhysicalDisk": {
                "measurement": [
                    "% Disk Time"
                ],
                "metrics_collection_interval": 60,
                "resources": [
                    "*"
                ]
            },
            "Processor": {
                "measurement": [
                    "% User Time",
                    "% Idle Time",
                    "% Interrupt Time"
                ],
                "metrics_collection_interval": 60,
                "resources": [
                    "_Total"
                ]
            }
        }
    }
}
Splunk Configuration
I hope you did your homework and ended up with a working Splunk Enterprise instance. If you haven’t had a chance to do that yet, please make sure you do so before continuing. You’ll also need to be able to access the Splunk Web interface.
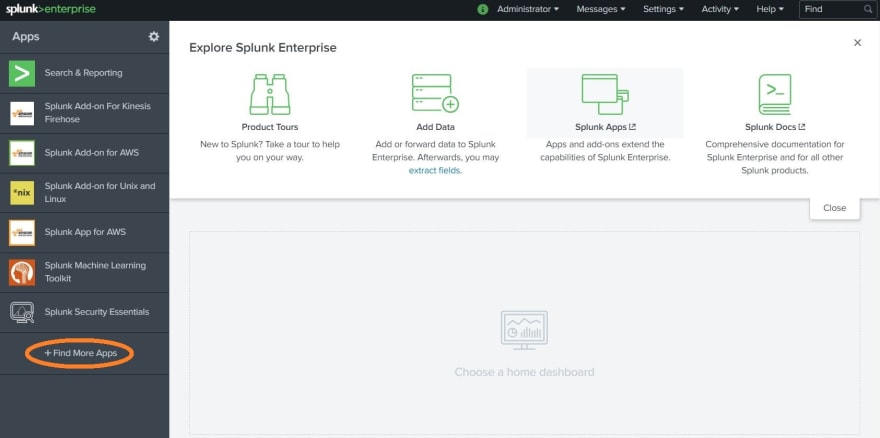
We’ll begin by installing the Splunk add-ons needed for our project. You can do this by logging into Splunk Web and clicking on “+ Find More Apps” from your application launcher/home dashboard. You may opt to install apps and add-ons using the CLI or by manually downloading packages from Splunk base and uploading them to your Splunk instance.
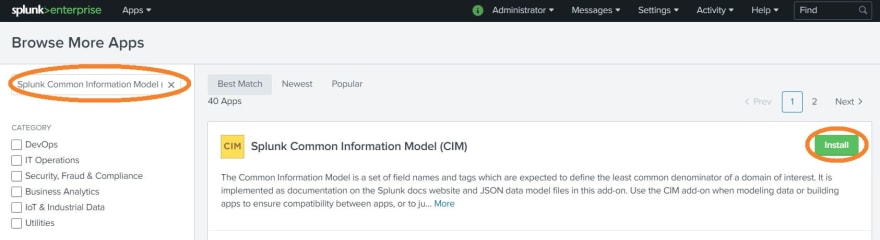
For this project we’ll need the Splunk Add-on for Amazon Web Services, the Splunk Common Information Model (CIM), and the Splunk Add-on for Microsoft Windows. You can look for these add-ons using the search box in the “Browse More Apps” page in Splunk Web. Click on “Install” once you’ve found them.
You’ll likely be prompted to reboot Splunk once you’ve installed these add-ons. Go ahead and restart even if you were not prompted to do so. You can restart Splunk from the web interface by going to Settings > Server Controls and selecting “Restart Splunk”.
Now, we’ll need to create some indexes for our AWS CloudWatch log data. I like to have an onboarding or sandbox index to fine tune my data before putting it into a production index. With that in mind, I named my indexes “onboarding_index” and “aws_windows” respectively. You can create indexes in Splunk Web by going to Settings > Indexes (under “Data”) and selecting “New Index”. We’ll use the default values for all the other settings.
Once your indexes have been created, you’ll have to configure the Splunk Add-On for AWS. You can do this in Splunk Web by clicking on the appropriate add-on from your home dashboard/app launcher. Now we’ll need to set up the the add-on starting with the Configuration portion. Click on Add* and enter the corresponding details for the AWS account you created. After adding your account, go to the Inputs section and select Create New Input. Pick the CloudWatch Logs Input Type from the Custom Data Type entry. Here you’ll need to provide a name for your input. I recommend something descriptive like aws_inputs_cw_logs_WinEventLogSystem. Enter the rest of the details for your AWS Account, AWS Region, Log Group, etc. and pick the “onboarding_index” that we created earlier. We’ll also be overriding the sourcetype field by replacing the default value of “aws:cloudwatchlogs” with “XmlWinEventLog” if you chose to format your EC2 Windows event logs using XML or “WinEventLog” if you’re using the classic event log format. Review your input's settings and hit Save when ready. I ended up creating an input for each one of my CloudWatch log groups. I would recommend you doing the same for now. Keep in mind that the AWS add-on inputs run on a scheduler (every 10 minutes by default) so you likely won’t see your EC2 logs for a little while. Go get yourself some coffee or a sandwich while you wait and don’t forget to pat yourself on the back for making it this far.
Remember installing the Splunk Add-On for Microsoft Windows earlier? The “WinEventLog” and “XmlWinEventLog” sourcetypes are used by this add-on for several things. The add-on is full of useful configurations including field extractions that will do 99% of the heavy lifting for us – which means we won’t have to write our own regular expressions and lots of other configurations ourselves.
Once the input has had a chance to retrieve logs from your CloudWatch log groups, you should be able to search for data using something like index="onboarding_index" sourcetype="XmlWinEventLog". You can view the extracted field names by clicking on the drop-down arrow to the left of an event. You'll also see the field names in the Interesting Fields column.
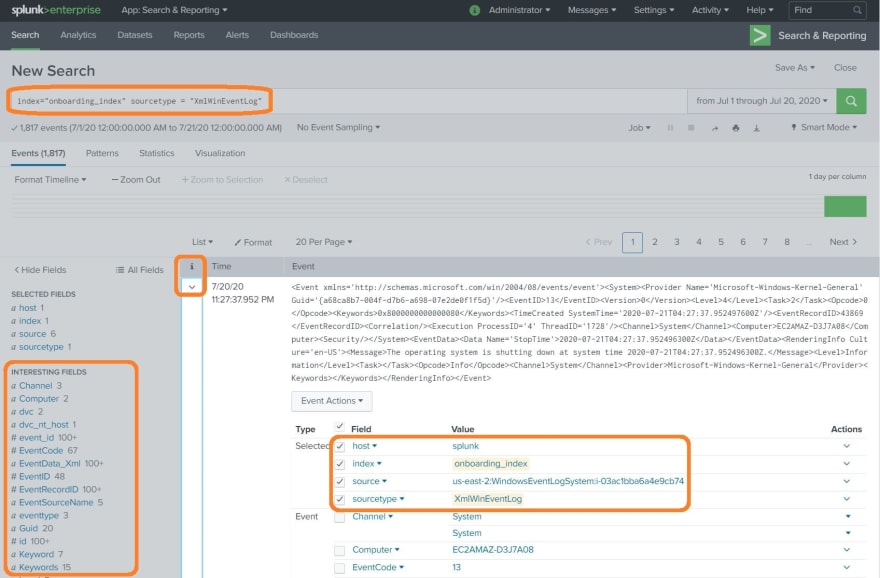
Things are looking good now. We have a wealth of fields that can serve multiple use cases. We could use some of these fields to create alerts or reports for things such as failed logins, unplanned system reboots, etc. Unfortunately, the Windows add-on also looks at the source field values when performing some of the CIM compliant field extractions. One could go through the tedious process of manually updating dozens, perhaps hundreds, of field extractions, field aliases, tags, and other configurations to include our current source names. However, that’s a ton of unsustainable work. I believe one of the AWS add-on’s Python scripts is where the source names are coming from. The pattern appears to be your-aws-region + your-log-group-name + your-log-stream-name. I suppose it would be possible to edit the Python script itself to rename the source whatever you prefer. However, I have not looked that deep and I’m not sure if there’s any dependencies that may break if you tinker with the add-on’s underlying scripts. Additionally, there’s a couple of trains of thoughts that discourage changing the source field. Some argue that this type of manipulation may compromise the integrity of your logging data in legal proceedings, audits, etc. I’m not quite sure how relevant that is, but you’ve been informed. Splunk themselves have this to say about the matter: “Avoid overriding the source key. The input layer provides a more accurate string to aid in problem analysis and investigation, recording the file from which the data was retrieved. Consider using source types, tagging, and search wildcards before overriding this value.”
But… I really want those CIM compliant fields in order to leverage the data models (and summary acceleration) from the CIM add-on. Again, Splunk gives you an enormous amount of flexibility (sometimes to a fault lol), so it’s entirely possible to create your own data models using whatever fields you want. The thing is, Splunk and their partners have already spent tons of time and effort into creating these resources. Realistically speaking, I don’t think I would be able to replicate all that work on my own and still be able to do my actual job.
Going back to overriding our source field values. I ended up doing so by adding a few entries to the props.conf and tranforms.conf files in $SPLUNK_HOME/etc/system/local. You can create these files using a text editor in case they aren’t in that directory. While going through these configurations, I decided that I’d like to extract the host values, as well. Please see below for details.
Here are the stanzas in my props.conf file:
# This stanza tells Splunk to look at the source “us-east-2:WindowsEventLogSystem” (“…” is a wildcard).
[source::us-east-2:WindowsEventLogSystem...]
TRANSFORMS-HostAndSourceOverrideforAWSXMLWinEventLogs = WinEventXmlHostOverrideForAWS, WinEventXmlSourceOverrideForAWS

# This stanza tells Splunk to look at the source “us-east-2:WindowsEventLogSecurity” (“…” is a wildcard).
[source::us-east-2:WindowsEventLogSecurity...]
TRANSFORMS-HostAndSourceOverrideforAWSXMLWinEventLogs = WinEventXmlHostOverrideForAWS, WinEventXmlSourceOverrideForAWS

# This stanza tells Splunk to look at the source “us-east-2:WindowsEventLogApplication” (“…” is a wildcard).
[source::us-east-2:WindowsEventLogApplication...]
TRANSFORMS-HostAndSourceOverrideforAWSXMLWinEventLogs = WinEventXmlHostOverrideForAWS, WinEventXmlSourceOverrideForAWS
And here are the stanzas in my transforms.conf file:
# This stanza is referred to by the it’s corresponding entry in props.conf.
# Please look at the transforms.conf documentation for an explanation of what each line is doing.
[WinEventXmlHostOverrideForAWS]
DEST_KEY = MetaData:Host
REGEX = <Computer>([^.<]+).*?<\/Computer>
FORMAT = host::$1
DEFAULT_VALUE = source::HOST:OVERRIDE:FAILED

[WinEventXmlSourceOverrideForAWS]
SOURCE_KEY = MetaData:Source
DEST_KEY = MetaData:Source
REGEX = ^.*:WindowsEventLog(Security|System|Application):.*$
FORMAT = source::XmlWinEventLog:$1
DEFAULT_VALUE = source::SOURCE:OVERRIDE:FAILED
Stanza “names” in props.conf (like [source::us-east-2:WindowsEventLogSystem...]) support PCRE expressions, with a few additions like “…”. Please review the relevant documentation page for additional information. Also, please note that the regex in transforms.conf are capturing the Security, System, and Application portion of my CloudWatch log group names. You’ll need to make sure the regex’s you use are consistent with your naming schemes. You’ll also have to account for your AWS region in the regular expression. I tried, and failed, to use a regular expression like [source::\w{2}(-gov)?-\w+-\d::WindowsEventLog...] to account for any AWS region. Let me know if you’re able to get it working. I’m curious as to why it didn’t work even when the regex successfully matches entries during testing.
You’ll need to reboot Splunk after making all the changes to your .conf files. I’d recommend rebooting from Splunk Web to avoid issues like accidentally starting Splunk as a different user and running into permissions issues (that’s a story for another time).
Final Thoughts
Barring any errors on my side when writing this guide, your AWS CloudWatch logs should now have the source, sourcetype, and host fields needed for full CIM compliant field extraction by the Windows add-on. It’s getting a bit late now, but I’ll be updating this post within the next few days in order to polish a couple sections and to expand a bit more on the significance of using CIM for data normalization – although, if you’re in security you likely already now my thoughts on that matter.

And… that’s about it! I hope this guide can save people some time, effort, and headaches. Please feel free to drop a comment if you spot any glaring issues or if you have any recommendations. Thanks for reading and see you in Part 3!
PS. Here's a couple of things you may want to consider eventually:
- Changing the index in your AWS add-on inputs to your poduction index.
- Scaling back the permissions of your IAM role used by the AWS add-on user.
- Using a single instance Splunk deployment allows for more straight forward configurations. Please make sure you do your research when you're ready to use these configurations in a distributed Splunk environment or if you're a Splunk Cloud user.

Top comments (0)