
Gaining insights into your infrastructure and application is crucial for debugging issues and avoiding failures. The following figure shows that all parts of the infrastructure are sending metrics to a service called Amazon CloudWatch. The metrics include CPU utilization of your containers, the number of database connections, the number of HTTP 5XX errors caused by the load balancer, and many more. Alarms monitor relevant metrics and send notifications to SNS (Amazon Simple Notification Service). SNS delivers the alarm notifications to you via email or other destinations.
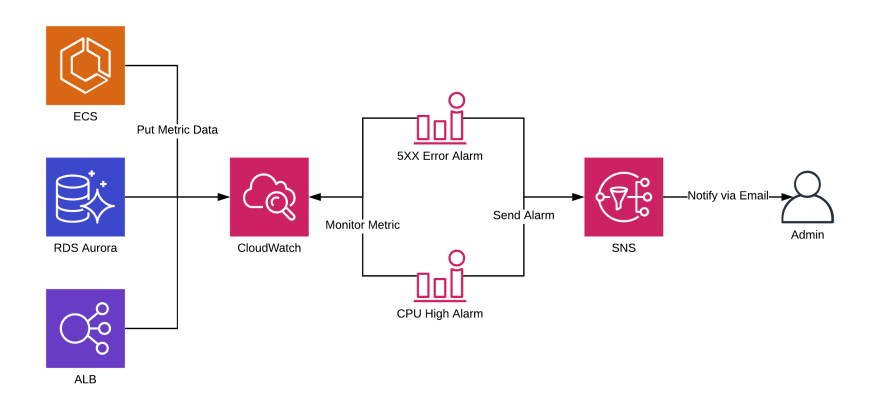
The following alarms make sure you are the first to know when your web application is not working as expected:
HTTPCodeELB5XXTooHighAlarm: An HTTP request was answered with a 5XX status code (server-side error) by the load balancer, most likely because there was no healthy container running.
TargetConnectionErrorCountTooHighAlarm: The load balancer was not able to establish a connection to one of the containers.
HTTPCodeTarget5XXTooHighAlarm: Your application responded with a 5XX status code (server-side error).
RejectedConnectionCountTooHighAlarm: A client connection to the load balancer was rejected.
CPUUtilizationTooHighAlarm: The CPU utilization of your containers is too high.
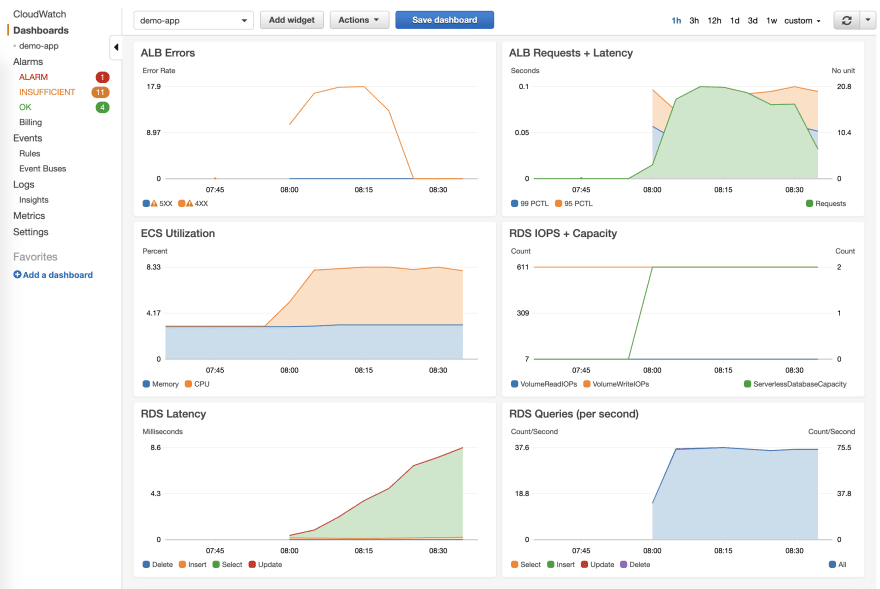
Our goal is to send alarm notifications only when the user experience is affected. However, you might want to get an overview of the state and utilization of your infrastructure from time to time. Use the predefined CloudWatch dashboard as illustrated in the screenshot below to do so. The dashboard includes:
- ALB Errors: the 4XX (client-side) and 5XX (server-side) error rate of your web application.
- ALB Requests + Latency: the number of requests, as well as the latency (99 and 95 percentiles).
- ECS Utilization: the CPU and memory utilization of your containers.
- RDS IOPS + Capacity: the capacity of your database, as well as the I/O throughput (IOPS).
-
RDS Latency: the latency of
SELECT,INSERT,UPDATE, andDELETEstatements. -
RDS Queries: the number of
SELECT,INSERT,UPDATE, andDELETEstatements.
Execute the following command from your working environment to fetch the dashboard's URL.
aws cloudformation describe-stacks --stack-name rapid-docker-on-aws \
  --query 'Stacks[0].Outputs[?OutputKey==`DashboardUrl`].OutputValue' \
  --output text
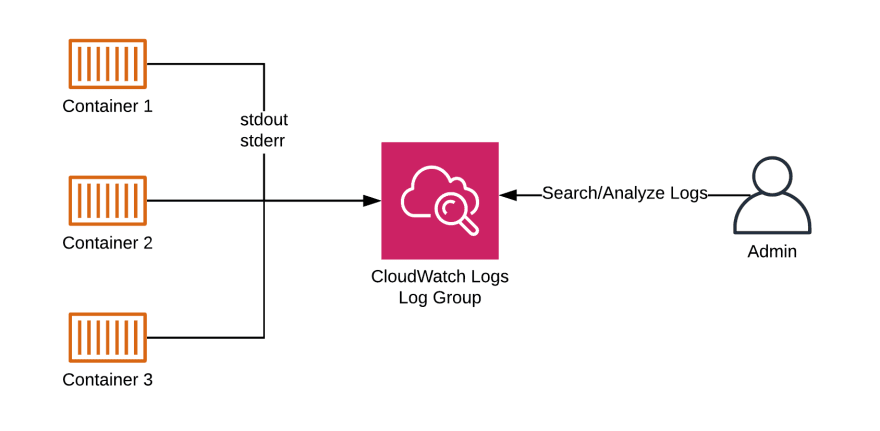
In summary, metrics and alarms allow you to monitor your cloud infrastructure and web application. One important piece for debugging is missing: log messages. As shown in the following figure, whenever your application writes a message to standard output (stdout) and standard error (stderr), these messages are automatically pushed to a log group in CloudWatch Logs. The log group collects all the log messages and stores them for 14 days. On top of that, you can search and analyze the log messages for debugging purposes whenever needed.
Execute the following command from your working environment to fetch the URL pointing to CloudWatch Logs Insights.
aws cloudformation describe-stacks --stack-name rapid-docker-on-aws \
  --query 'Stacks[0].Outputs[?OutputKey==`AppLogsUrl`].OutputValue' \
  --output text
The following screenshot shows CloudWatch Logs Insights in action:

To search through your logs, you need to:
- Modify the query.
- Select a time span.
- Hit the Run query button.
Warning Choose a time span as short as possible to avoid unnecessary costs when searching the log messages.
Let's start with a simple query filtering all log messages from the proxy container (NGINX):
fields @timestamp, @message
| sort @timestamp desc
| filter @logStream like 'proxy/'
And a similar query to filter all log messages from the app container (e.g., PHP-FPM):
fields @timestamp, @message
| sort @timestamp desc
| filter @logStream like 'app/'
This more advanced query filters all log messages from the proxy container (e.g., NGINX) containing the search term “404” in the log message:
fields @timestamp, @message
| sort @timestamp desc
| filter @logStream like 'proxy/' AND @message like '404'
Another example: this query filters all log messages from the app container (e.g., PHP-FPM) containing the search term “error” in the log message:
fields @timestamp, @message
| sort @timestamp desc
| filter @logStream like 'app/' AND @message like 'error'
Want to learn more about the query syntax? Check out the CloudWatch Logs Insights Query Syntax.
In summary, with CloudWatch metrics, alarms, and logs, monitoring and debugging your web application is simple.
Do you have any questions? Please leave them in the comments. This is the last post of a series. Follow me to make sure you are not missing the following posts.
This post is an excerpt from our new book Rapid Docker on AWS. The book includes code samples for PHP, Ruby (Rails), Python (Django), Java (Spring Boot), and Node.js (Express).


Top comments (0)