
By: Peter Solymos
What makes programming languages like R and Python great for making data
applications is the wealth of contributed extension packages that
supercharge app development. You can turn your code into an interactive
web app with not much extra code once you have a workflow and an
interesting question.
We have reviewed Docker
basics and
how to dockerize a very simple Shiny
app. For
anything that is a little bit more complex, you will have to manage
dependencies. Dependency management is one of the most important aspects
of app development with Docker. In this post you will learn about
different options.
Workflow
In our world today, COVID-19 data needs no introduction. There are
countless dashboards out there showing case counts in space and time.
This app is no different. You can find all the R code associated with
this post in this GitHub repository:

Download or clone the repository and open the 01-workflow directory.
Now install/load some packages (forecast, jsonlite, ggplot2, and
plotly), source the functions.R file. The workflow looks like this:
pred <- "canada-combined" %>%
    get_data() %>%
    process_data(
        cases = "confirmed",
        last = "2021-05-01") %>%
    fit_model() %>%
    predict_model(
        window = 30,
        level = 95)
- pick a country (the available slugified country codes are explained in the source file),
- get the data from a daily updated web interface (JSON API),
- process the raw data: what kinds of cases (confirmed/deaths) to consider and what should be the last day of the time series,
- fit time series model to the data,
- forecast x days following the last day of the time series and show prediction intervals.
The data source is the
Center for Systems Science and Engineering (CSSE) at Johns Hopkins
University. The flat files provided by the CSSE are further processed to
provide a JSON API (read more about the
API
and its endpoints, or
explore the data interactively
here).
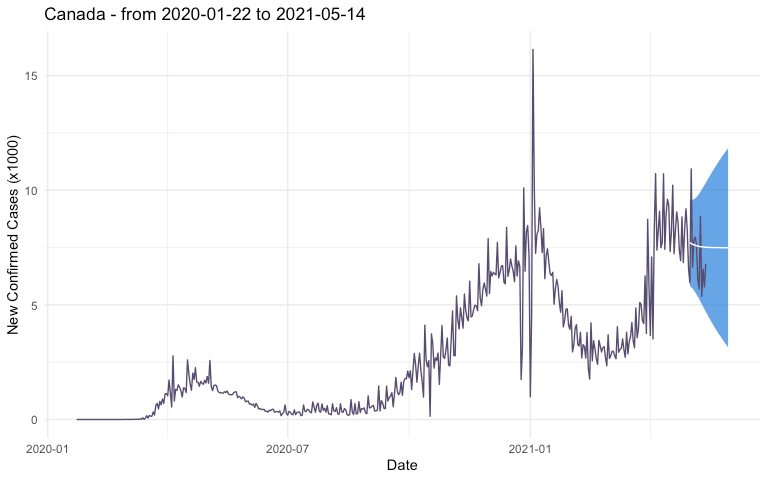
We use exponential
smoothing (ETS) as
a time series forecasting method from the
forecast package. There
are many other time series forecasting methods (like ARIMA etc.). We
picked ETS because of its ease of use for our demonstration purposes.
We can visualize the pred object as plot_all(pred) which returns a
ggplot2 object like this
one:
Turn the ggplot2 object into an interactive
plotly graph as
ggplotly(plot_all(pred)).
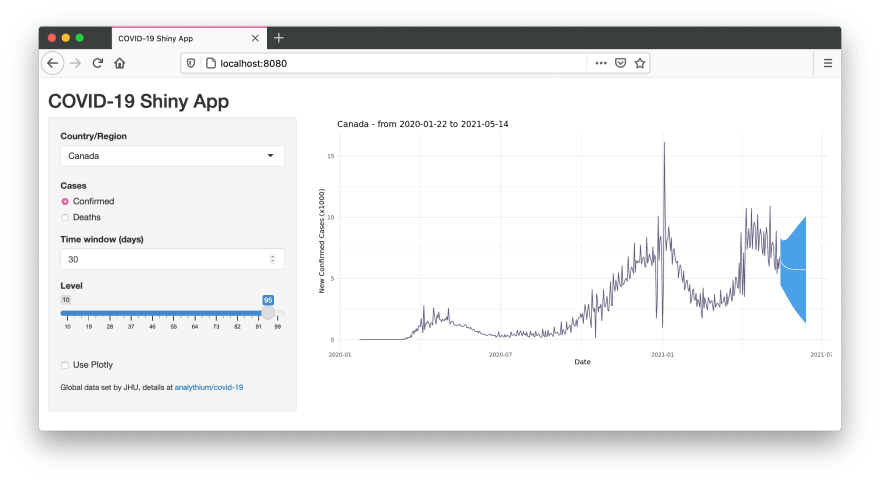
Shiny app
Change to the 02-shiny-app folder which has the following files:
.
├── README.md
├── app
│   ├── functions.R
│   ├── global.R
│   ├── server.R
│   └── ui.R
└── covidapp.Rproj
Run the app
locally as
shiny::runApp("app"). It will look like this with controls for
country, case type, time window, prediction interval, and a checkbox to
switch between the ggplot2 or plotly output types:
Play around with the app then let's move on to putting it in a
container.
Explicit dependencies in Dockerfile
The first approach is to use RUN statements in the Dockerfile to
install the required packages. Check the Dockerfile in the
03-docker-basic folder. The structure of the Dockerfile follows the
general pattern outlined in
this
post. We use the rocker/r-ubuntu:20.04 base image and specify the
RStudio Package Manager (RSPM)
CRAN repository in Rprofile.site so that we can install binary
packages for speedy Docker builds. Here are the relevant lines:
FROM rocker/r-ubuntu:20.04
...
COPY Rprofile.site /etc/R
...
RUN install.r shiny forecast jsonlite ggplot2 htmltools
RUN Rscript -e "install.packages('plotly')"
...
Required packages are installed with the littler
utility
install.r (littler is installed on all Rocker base images). You can
also use Rscript to call install.packages(). There are other options
too, like install2.r from littler, or using
R -q -e install.packages() – -q suppresses the startup message, -e
executes an expression then quits.
Build and test the image locally, use any image name you like (in
export IMAGE=""), then visit http://localhost:8080 to see the app:
# name of the image
export IMAGE="analythium/covidapp-shiny:basic"

# build image
docker build -t $IMAGE .

# run and test locally
docker run -p 8080:3838 $IMAGE
Use DESCRIPTION file
The second approach is to record the dependencies in the DESCRIPTION
file. You can find the example in the 04-docker-deps folder. The
DESCRIPTION
file
contains basic information about an R package. The file states package
dependencies and is used when installing the packages and its
dependencies. The install_deps() function from the
remotes package can
install dependencies stated in a DESCRIPTION file. The DESCRIPTION
file used here is quite rudimentary but it states the dependencies to be
installed nonetheless:
Imports:
  shiny,
  forecast,
  jsonlite,
  ggplot2,
  htmltools,
  plotly
Use the same Ubuntu based R base image and the RSPM CRAN repository.
Install the remotes package, copy the DESCRIPTION file into the image.
Call remotes::install_deps() which will find the DESCRIPTION file in
the current directory. Here are the relevant lines from the
Dockerfile:
FROM rocker/r-ubuntu:20.04
...
COPY Rprofile.site /etc/R
...
RUN install.r remotes
COPY DESCRIPTION .
RUN Rscript -e "remotes::install_deps()"
...
Build and test the image as before, but use a different tag:
# name of the image
export IMAGE="analythium/covidapp-shiny:deps"

# build image
docker build -t $IMAGE .

# run and test locally
docker run -p 8080:3838 $IMAGE
Use the renv R package
The renv package is a
versatile dependency management toolkit for R. You can discover
dependencies with renv::init() and occasionally save the state of
these libraries to a lockfile with renv::snapshot(). The nice thing
about this approach is that the exact version of each package is
recorded that makes Docker builds reproducible.
Switch to the 05-docker-renv directory and inspect the Dockerfile.
Here are the most important lines (Focal Fossa is the code name for
Ubuntu Linux version 20.04 LTS that matches our base image):
FROM rocker/r-ubuntu:20.04
...
RUN install.r remotes renv
...
COPY ./renv.lock .
RUN Rscript -e "options(renv.consent = TRUE); \
    renv::restore(lockfile = '/home/app/renv.lock', repos = \
    c(CRAN='https://packagemanager.rstudio.com/all/__linux__/focal/latest'))"
...
We need the remotes and renv packages. Then copy the renv.lock file,
call renv::restore() by specifying the lockfile and the RSPM CRAN
repository. The renv.consent = TRUE option is needed because this is a
fresh setup (i.e. not copying the whole renv project).
Tag the Docker image with :renv and build:
# name of the image
export IMAGE="analythium/covidapp-shiny:renv"

# build image
docker build -t $IMAGE .

# run and test locally
docker run -p 8080:3838 $IMAGE
Comparison
We built the same Shiny app in three different ways. The sizes of the
three images differ quite a bit, with the :renv image being 40% bigger
that the other two images:
$ docker images

REPOSITORY                  TAG                 SIZE
analythium/covidapp-shiny   renv                1.7GB
analythium/covidapp-shiny   deps                1.18GB
analythium/covidapp-shiny   basic               1.24GB
The :basic image has 105 packages installed (try
docker run analythium/covidapp-shiny:basic R -q -e 'nrow(installed.packages())').
The :deps image has remotes added on top of these, the :renv image
has remotes, renv and BH as extras. BH seems to be responsible for the
size difference, this package provides Boost C++ header
files. The COVID-19 app works
perfectly fine without BH. In this particular case, this is a price to
pay for the convenience of automatic dependency discovery provided by
renv.
The renv package has a few different snapshot
modes.
The default is called "implicit". This mode adds the intersection of all
your installed packages and those used in your project as inferred by
renv::dependencies() to the lockfile. Another mode, called "explicit",
which only capture packages which are listed in the project
DESCRIPTION file. For the COVID-19 app, both these resulted in
identical lockfiles. You can use renv::remove("BH") to remove BH from
the project or use the "custom" model and list all the packages to be
added to the lockfile.
If you go with the other two approaches, explicitly stating dependencies
in the Dockerfile or in the DESCRIPTION file, you might end up
missing some packages at first. These approaches might needs a few
iterations before getting the package list just right.
Another important difference between these approaches is that renv pins
the exact package versions in the lockfile. If you want to install
versioned packages, use the remotes::install_version() function in the
Dockerfile. The version-tagged Rocker
images will by default use the
MRAN snapshot
mirror
associated with the most recent date for which that image was current.
Summary
You learnt the basics of dependency management for Shiny apps with
Docker. Now you can pick and refine an approach that you like most
(there is no need to build the same app multiple ways).
Of course there is a lot more to talk about from different base images
to managing system dependencies for the R packages. We'll cover that in
an upcoming post.
Further reading
- Using renv with Docker
- Pin package versions by Roman Luštrik
- An Introduction to Rocker describing versioned images and more
- The Rockerverse: a recent update on R+Docker

Top comments (0)