
Introduction
As a seasoned front-end developer, my passion extends beyond coding to sharing knowledge and engaging in enlightening discussions about intriguing tech topics. Often, I find that diagrams are a powerful medium to convey complex ideas - a picture, after all, is worth a thousand words.
However, creating diagrams, whether through tools like draw.io or Excalidraw, isn't always a walk in the park. It can be time-consuming, and a quick brainstorming session could get mired in the details of diagram crafting. This is where Mermaid, a markdown-like script language for generating diagrams, and AI technology come to the rescue.
Leveraging these technologies, I can swiftly translate the ideas sprouting in my mind into clear, precise diagrams. They serve as a catalyst not just for facilitating my understanding of complex topics, but also for sharing these insights with others effectively.
In this blog post, I'll guide you on harnessing the power of ChatGPT and Mermaid to create impactful diagrams and garner deeper understandings of challenging subjects. Whether you aim to boost your personal learning or articulate your ideas more clearly to your peers, these tools can be your secret weapons. Let's delve into this exciting journey of idea visualization!
"The power of imagination makes us infinite."
- John Muir
Introduction to Mermaid
Mermaid is an open-source, markdown-like script language for generating charts and diagrams. The beauty of Mermaid lies in its simplicity; you can create intricate diagrams using just text descriptions, making it an excellent choice for documentation, blog posts, and development work.
Mermaid supports a broad range of diagrams, including:
- Flowcharts: Ideal for visualizing processes or workflows, such as the process flow in an e-commerce checkout system.
flowchart LR
  A[Customer selects products] --> B[Customer reviews order]
  B --> C{Payment Successful?}
  C -->|Yes| D[Generate Invoice]
  D --> E[Dispatch goods]
  C -->|No| F[Redirect to Payment]

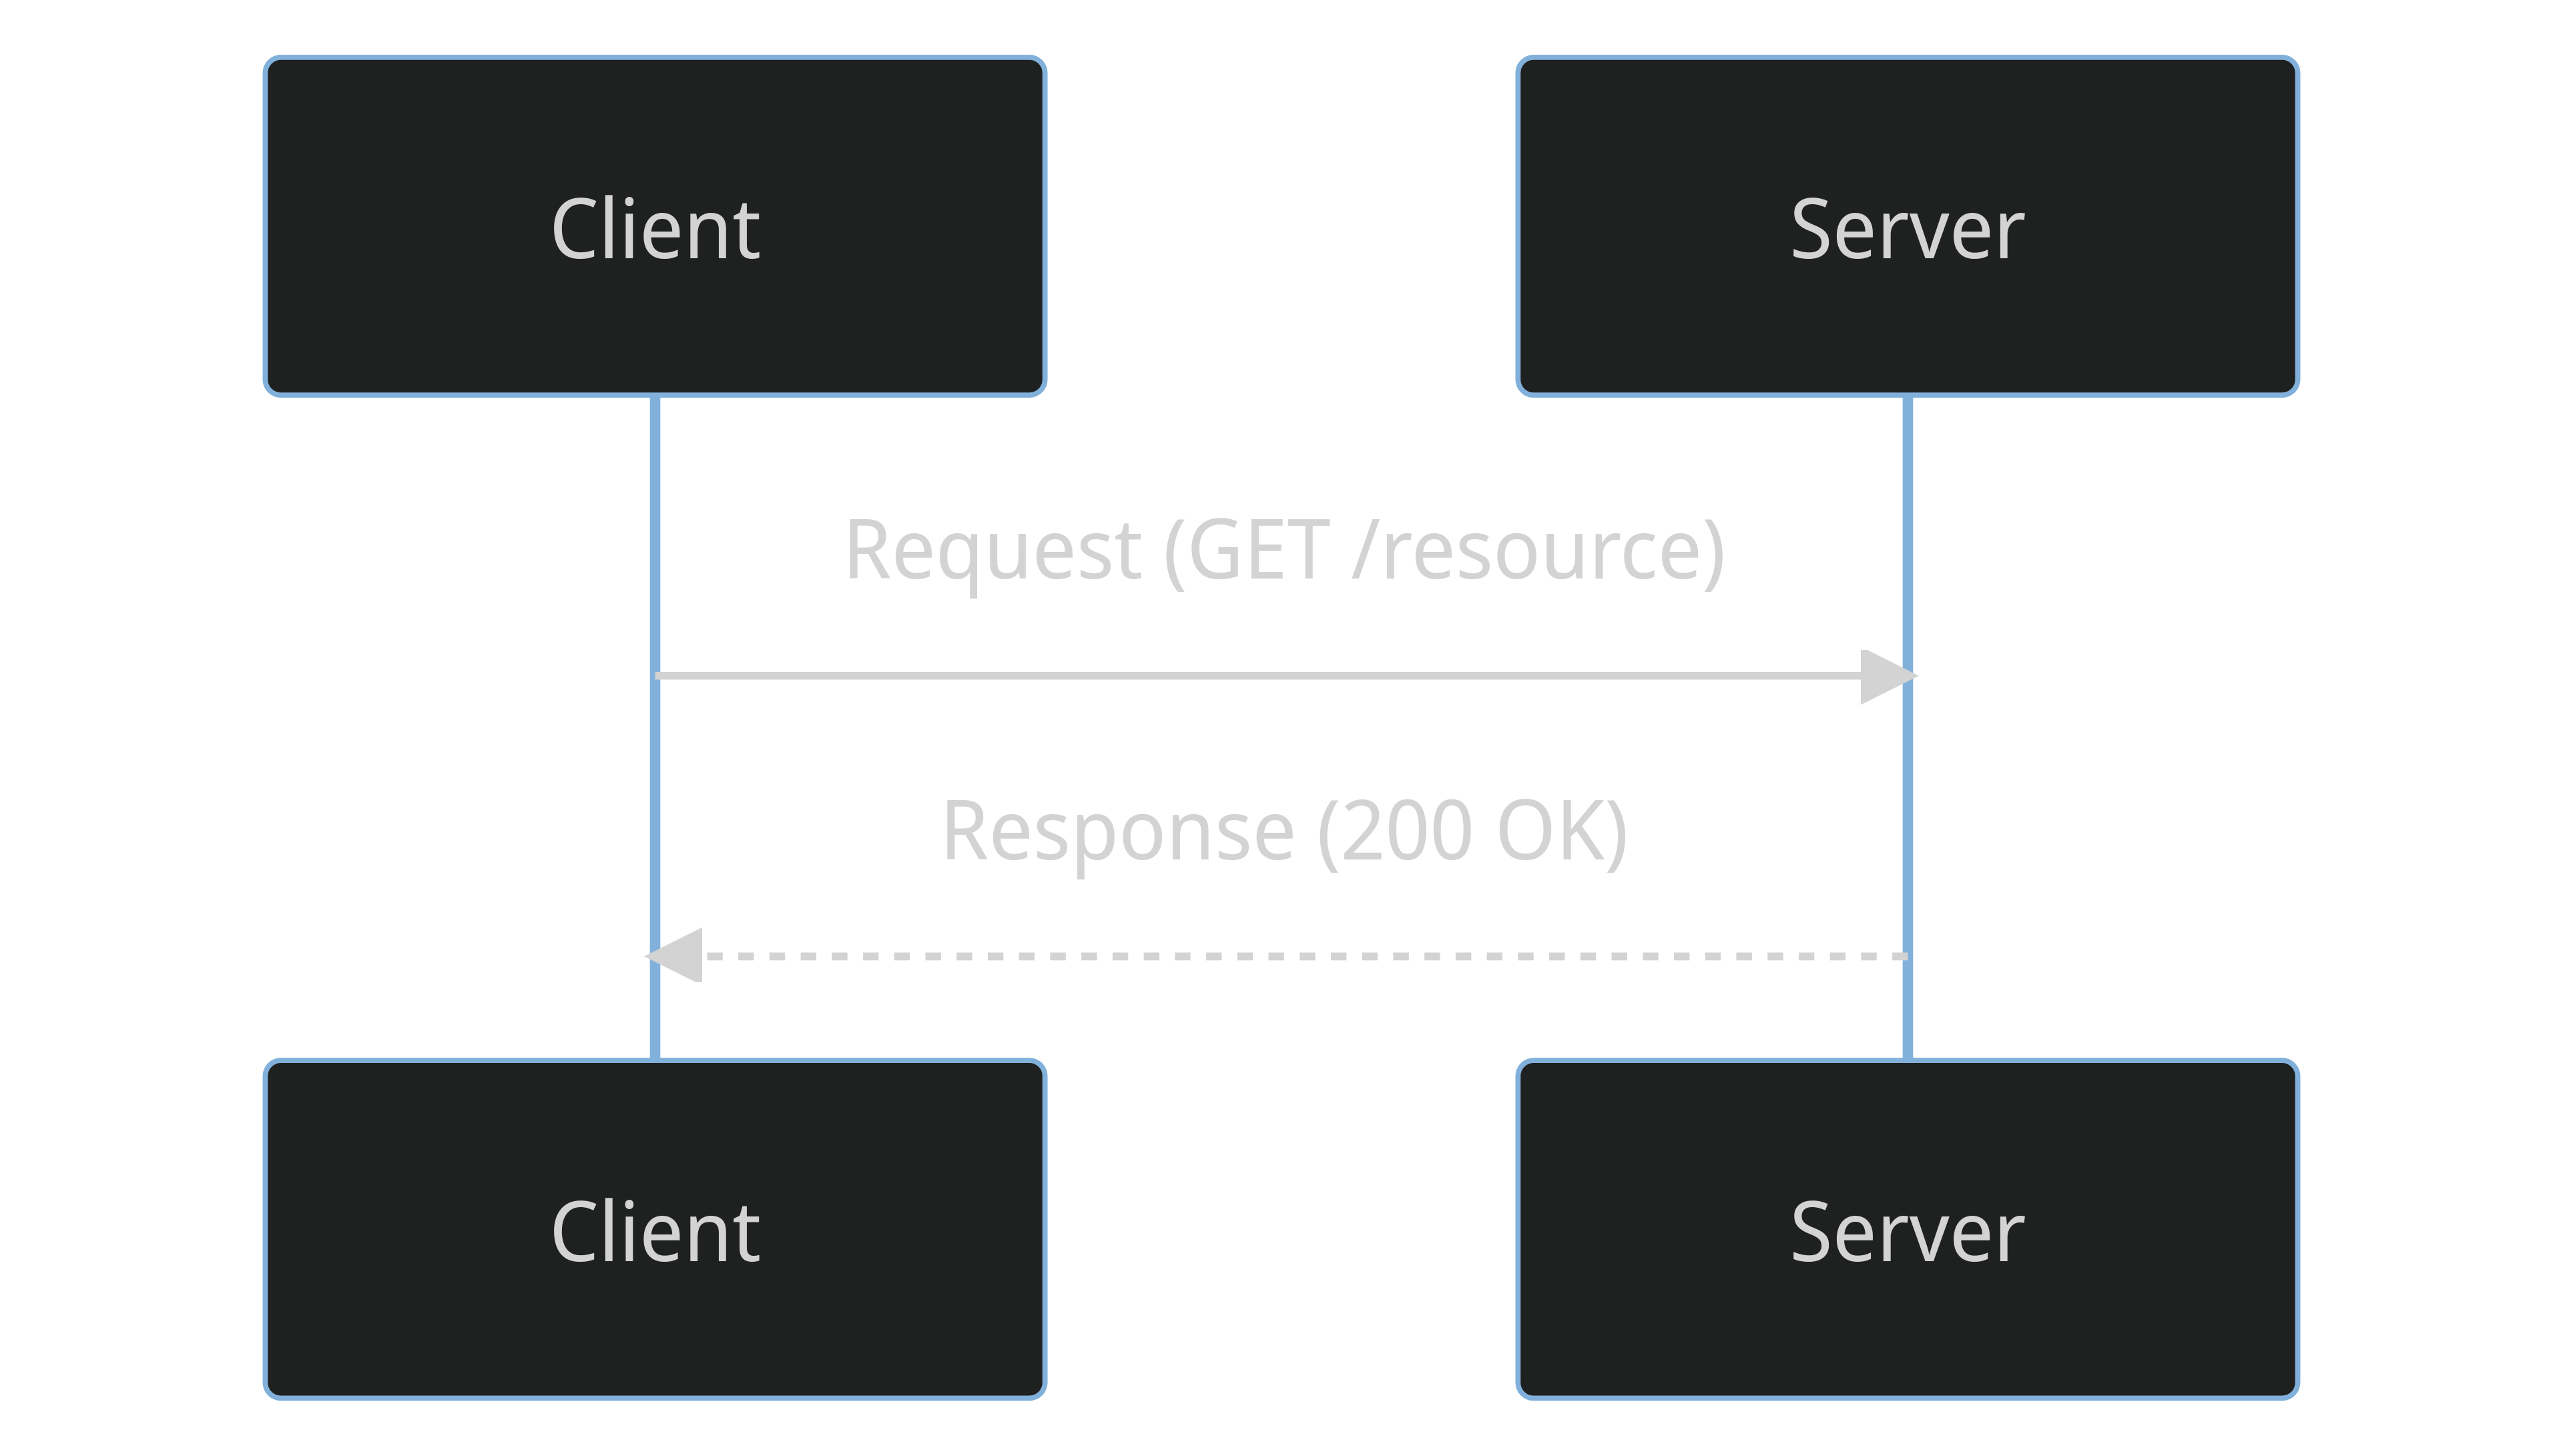
- Sequence diagrams: Great for understanding interactions in a system, like the request-response cycle in a client-server model. ```mermaid
sequenceDiagram
participant Client
participant Server
Client->>Server: Request (GET /resource)
Server-->>Client: Response (200 OK)
- **Class diagrams**: Useful for visualizing the structure of object-oriented systems, like a basic structure of an animal class in a zoological application.
```mermaid
classDiagram
Animal <|-- Duck
Animal <|-- Fish
Animal <|-- Zebra
Animal : +int age
Animal : +String gender
Animal: +isMammal()
Animal: +mate()

- State diagrams: Excellent for describing the behavior of systems, like the various states a software process might have in an operating system.
stateDiagram
    [*] --> New : Process creation
    New --> Ready : Loaded into memory
    Ready --> Running : Processor assigned
    Running --> Exit : Process finished
    Running --> Ready : Interrupt
    Running --> Blocked : I/O required
    Blocked --> Ready : I/O complete

And many more, including Gantt charts, pie charts, etc.
Now that you have a basic understanding of what Mermaid is capable of, let's discuss how ChatGPT can help generate ideas for these diagrams.
Why Use ChatGPT and Mermaid?
ChatGPT leverages machine learning to understand and generate human-like text based on the input it receives. It can aid in brainstorming ideas, generating examples, and providing explanations for complex topics. On the other hand, Mermaid is a simple markdown-like script language for generating charts and diagrams. Using Mermaid, you can create flowcharts, sequence diagrams, Gantt charts, and more with just a few lines of code.
When used in conjunction, these two tools can fast-track your diagramming process, helping you develop a multitude of ideas, and create effective, comprehensive diagrams in no time.
How to Get Started
Here is a practical example of how to use ChatGPT and Mermaid to create diagrams. Imagine you want to understand and illustrate the concept of Server-Side Rendering (SSR) in Nuxt, a popular Vue framework.
Start by asking ChatGPT to explain the concept:
"Can you explain how Nuxt.js performs server-side rendering?"
ChatGPT will respond with a detailed explanation. After you have a better understanding of the topic, you can ask ChatGPT to create a Mermaid diagram for it:
"Can you create a Mermaid diagram to show how Nuxt.js performs server-side rendering?"
ChatGPT will provide you with Mermaid code which you can paste into any tool that supports Mermaid syntax.
This is how the mermaid code will look for example
sequenceDiagram
  participant Client as Client Browser
  participant Nuxt as Nuxt.js Server
  participant Vue as Vue.js Application
  participant API as Backend API

  Client->>Nuxt: Initial Request
  Nuxt->>Vue: SSR Starts
  Vue->>API: API Calls (if any)
  API-->>Vue: API Responses
  Vue->>Nuxt: Rendered HTML
  Nuxt-->>Client: HTML Content

  Note over Client,Nuxt: Now the client has the first view ready and Vue.js takes over (hydration begins).

  Client->>Vue: Interactions with page (clicks, form inputs etc.)
  Vue->>API: API Calls (if any)
  API-->>Vue: API Responses
  Vue->>Client: Updates DOM
This is how the diagram will than look:

The beauty of ChatGPT is that it doesn't stop there. If the initial diagram doesn't quite match what you had in mind, you can ask for alternatives:
"Can you give me different ways to display this in a diagram with Mermaid?"
ChatGPT will then provide different types of diagrams, such as flowcharts, sequence diagrams, or state diagrams, each offering a unique perspective on the same topic.
Flowchart

State Diagram

How to See Your Diagrams
There are multiple ways to visualize your Mermaid diagrams:
- Mermaid Live Editor
One of the easiest ways is to use the Mermaid Live Editor available at https://mermaid.live/. Just paste the code you got from ChatGPT into the editor, and the diagram will be rendered automatically.
- Visual Studio Code
If you are using Visual Studio Code (VS Code), you can install a Mermaid extension like Markdown Preview Mermaid Support itemName=jdinhlife.gruvbox-mermaid). Then, you can create or edit a markdown (.md) file and use the following snippet:
```mermaid
    graph TD;
        A-->B;
        A-->C;
        B-->D;
        C-->D;
    ```
-
In html
You can also embed Mermaid diagrams directly in your HTML files. After including the mermaid.js library, you can place your Mermaid code inside a with the class "mermaid". Here's an example:
<!DOCTYPE html>
<html>
    <head>
        <script src="https://unpkg.com/mermaid/dist/mermaid.min.js"></script>
        <script>mermaid.initialize({startOnLoad:true});</script>
    </head>
    <body>
        <div class="mermaid">
            graph TD
            A-->B
            A-->C
            B-->D
            C-->D
        </div>
    </body>
</html>
When you open this HTML file in a browser, your Mermaid diagram will be rendered on the page.
Conclusion
The blend of AI and diagramming tools like Mermaid provides us with a powerful method to simplify complex concepts. With just a few lines of text, we can generate diagrams that used to take hours to craft. By revolutionizing the way we learn and share ideas, this innovative approach can truly bring the power of technology to our fingertips.
So, go ahead, give it a try, and experience how AI and Mermaid can revolutionize your diagramming process. If you have any diagrams you're particularly proud of or any tips to share, feel free to drop them in the comments below. Let's learn together!
Enjoyed this post? Follow me on X for more Vue and TypeScript content:


Top comments (2)
That's cool. Very useful article.
And I also like to recommend a chrome plugin: Diagram AI
Diagram AI addresses key challenges in diagram creation:
This article is spot on. I have created a tool to actually do this as describing the concepts in plain english is much easier.
huehive.co/tools/diagrams