
Photo by Markus Spiske @unsplash
Today I wanted to share with you a few tips about the one and only console object, which provides access to the browser debugging console for developers. I have been using it since the very first time I learned about web development (about 10 years ago), and I have learned some useful tips along the way to be more efficient while using it. Without further ado, let's dive in.

Output types
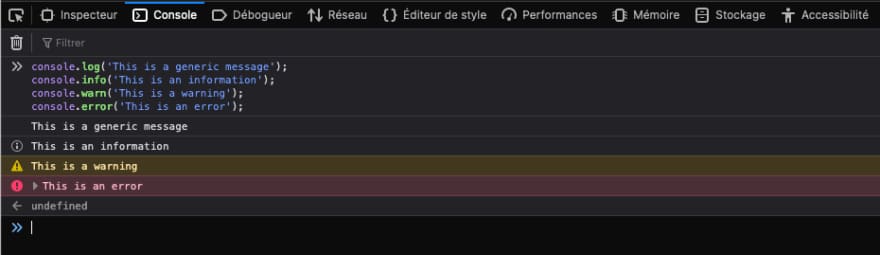
Let's start with the basics, which is controlling the type of output when printing messages in the browser console. console.log being the generic output, it can be useful to know how to be more specific:
- ℹ️ Information:
console.info() - ⚠️ Warning:
console.warn() - 🚨 Error:
console.error()
I personally don't use console.info that much, but I definitely use warn and error a lot, for example when a call to an API went wrong.
Formatting
Simple variables
Quite often, we want to console.log variables values, to understand what's going on at some point in our code. There are a few options here:
const userName = "foo"
const userEmail = "foo@bar.com"

// TIP: `console.log` accepts any number of arguments, it will just concatenate a `toString()` representation of each argument to the console
console.log("user is ", userName, userEmail)
// > user is foo foo@bar.com

// You can also use template literal strings:
console.log(`user is ${userName} ${userEmail}`)
// > user is foo foo@bar.com
Objects
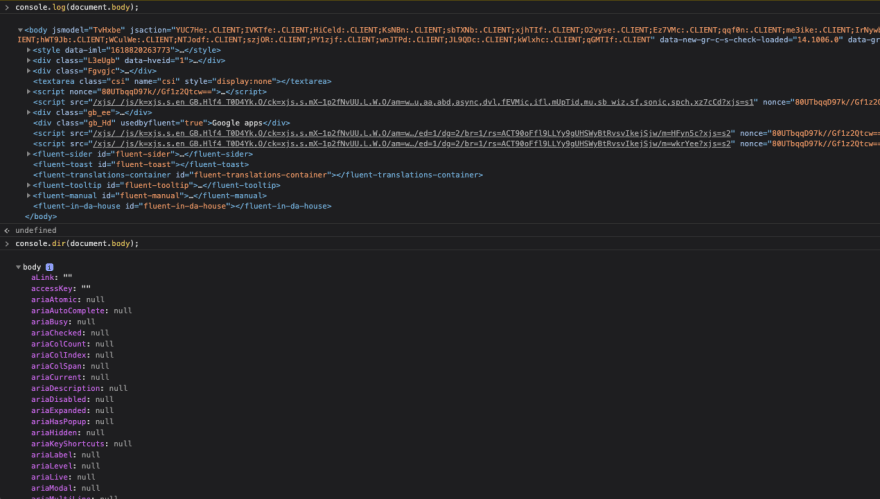
When printing objects or arrays, most of the time console.log will do the job, but I found out that using console.dir can provide the developer with a better view of the printed object. The behaviors of these methods can differ slightly from a browser to another, but the main difference is that console.log will print a toString representation of the object, while console.dir will print a navigable tree. This is particularly true when printing out DOM objects with Chrome, as shown by the screenshot below:
Tabular data
Finally, depending on the data you're working with, sometimes a table view can be way more practical than a tree view. This one can save you a lot of "click click click" 😇. Let's take a look at this simple example. We have this array of objects, representing our users, and we want to print it in the browser console:
const users = [
  { username: "foo", email: "foo@foo.com", isActive: true },
  { username: "bar", email: "bar@bar.com", isActive: false },
  { username: "joe", email: "joe@gmail.com", isActive: true },
]
Here's what the output will be in the console, using console.log versus console.table:

Pretty neat, right?
Styling
Who said console outputs need to be plain and sad? console.log method actually supports inline styling, and I think this is really cool:
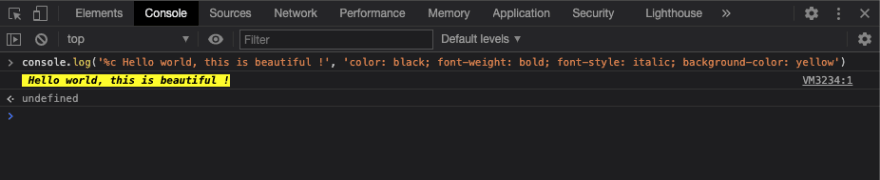
Sexy, isn't it? Here is how it works: you just need to prefix your message with "%c", and pass inline CSS rules as the second argument.
console.log("%c <message>", "<inline CSS>")

// Example
console.log("%c hello world", "color: white; background-color: tomatoe")
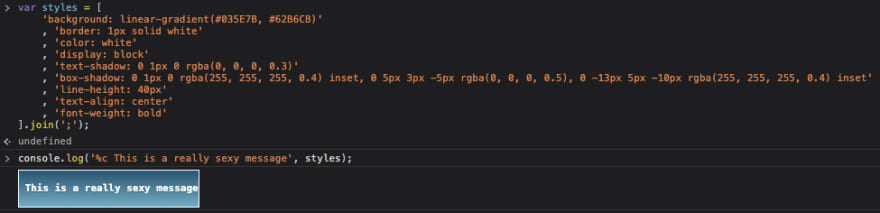
If you wanna go wild with CSS3, well, you can!
var styles = [
  "background: linear-gradient(#035E7B, #62B6CB)",
  "border: 1px solid white",
  "color: white",
  "display: block",
  "text-shadow: 0 1px 0 rgba(0, 0, 0, 0.3)",
  "box-shadow: 0 1px 0 rgba(255, 255, 255, 0.4) inset, 0 5px 3px -5px rgba(0, 0, 0, 0.5), 0 -13px 5px -10px rgba(255, 255, 255, 0.4) inset",
  "line-height: 40px",
  "text-align: center",
  "font-weight: bold",
]

console.log("%c This is a really sexy message", styles.join(";"))
Debugging
Seeing the meme at the beginning of this post, you might have wondered...
Is
console.tracereally a thing?
Yes it is, and it can come up quite handy in certain situations:
The console interface's trace() method outputs a stack trace to the Web Console.
This can help you get a better understanding of what's going on, which methods are called in which order, and where it's crashing. But there is a better way: our friend the debugger!
Depending on your project/editor configuration, it can be a bit tricky to run a debug mode. Luckily for us, the Chrome dev-tools provide a very useful command to pause the execution of our code and inspect variables:
function saveUser(user) {
  // ...
  debugger // Yep, it doesn't get much easier
  // ...
}
This will open up the JavaScript debugging pane of the developer tools, allowing you to inspect, step into the next function call, resume execution, etc. For more information about the Chrome DevTools debugger, check out this great article.

Top comments (0)