In this post I'd like to show you how to create the Load Test results dashboard using plotly and Dash.
Assuming that you use the SoapUi opensource version to run your load tests, you know there are very limited features to -
- Archive the test results.
- Analyze how the system is performing with respect to the previous builds.
- Dashboard with graphical representation to show the performance of the system over time and load.
Here is the solution which I created to overcome these limitations.
- Since we know a .csv file is generated with the statistics when we run the load test from the command prompt.
I used
PythonwithPandasto filter out the unwanted data and archive the results in the database usingpymssql.
- Now, I've my results archived in the database, I used the
Dashandplotlyto create a dashboard and hosted it on a server which can be accessible to the stakeholders.
So, Let's get Started !
Code Repository - https://github.com/akshayca/SoapUiLoadTestDashboard
Step 1 - Execution
Create a runLoadTest.bat file to run all your Load Tests from command prompt
I've used the calculator example project.
Below is the project structure, I've placed my example-soapui-project.xml in the TestCase folder -
the execution command would look something like this -
>set projectRootFolder=C:\SoapUiLoadTest\TestCase\

>set ReportFoler=C:\SoapUiLoadTest\TestResults\

>set limit=15
>set thread=10

>loadtestrunner.bat -s"CalculatorSoap TestSuite" -c"Add TestCase"  -l"LoadTestAdd" -m%limit% -n%thread% -r -f%ReportFoler% "%projectRootFolder%example-soapui-project.xml"
Run the runLoadTest.bat, execution will start and the reports will be generated with the current timestamp.
Step 2 - Data Archiving and Reporting
Create a database called 'SoapUILoadTestResults' to archive the results -

Run the createDashboard.py
Note: You need to pip install all the imports used for this project and have bWLwgP.css file in the assets folder.
Once the execution is completed, you can the check the data archived in the database.
Dash will be running on http://127.0.0.1:8050/
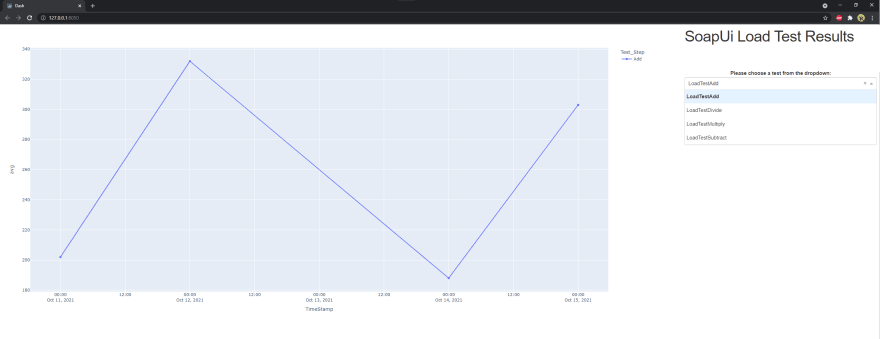
Once you have enough data on your dashboard would look something like this -
Code repository - https://github.com/akshayca/SoapUiLoadTestDashboard
Let me know if you need any help with this :)


Top comments (0)