Excerpt
Once you implement a feature into your application, you need to get an insight on feature usage. In this post, my intention is to guide you through the steps for achieving this using ELK (Elasticsearch, Logstash, Kibana) Stack.
Planning: Data Preparation
Regardless of underlying platform, we should have curated data ready on our hand when we want to analyze. Of the biggest challenge in Data Engineering (DE) or Data Science (DS) is to curate data from raw/source data.
For example, assume an analytical question is: Which browser is most popular among our users?. To analyze, you have 2 option to consider:
- Raw NGinx log which looks like this:
123.123.123.123 - - [21/Jul/2007:16:37:24 +0100] "GET /feature1/a2e1a325-938a-41e2-a0ef-517330f398b1.html HTTP/1.1" 404 999 "-" "Mozilla/5.0 (Windows NT 10.0; WOW64; rv:60.0) Gecko/20090907 Firefox/60.0". - Parsed and indexed log into Elasticsearch which looks like this:
{"Browser": "Firefox 60.0", ", "AccessDate": "21/Jul/2007:16:37:24 +0100" }
The parsed log is better. You can write SQL on it and get desired result of the analytical question. However, it is worth to point out that parsed log cannot be created magically. For this we have take some additional steps.
Planning: Simulation
We will simulate real world usage via Artillery.io scenario. If you are not familiar with it, no issue. Just look into the configuration yml file and it is self-explanatory.
First, we will call the scenario with 100 users with 80/20 split between Feature1 and Feature2. Then, we will replicate this with 50/50 split. So, our end result should show that Feature1 is used ~65% times and Feature2 is used ~35%.
Setup preparation - Application Server
Docker is my preferred way to work. For this post, there is no necessity to setup an application to demo. We will just setup Nginx and call http://example.com/feature1 and http://example.com/feature2 urls to mimic actual call to Feature1 and Feature2.
Setup preparation - Docker images
We will use Docker for preparing environment. In the final setup, we will run everything in docker-compose so that 1 container can communicate with another. However, before going there, we will manually pull the images to speed up the process. You will get the elasticsearch docker images here and nginx image in Dockerhub.
Setup preparation - Backend configuration
Let us mention technologies and major configuration(s) required:
- Nginx: Where to write files? We are not routing anything for this post, so primary configuration can be deferred.
- Elasticsearch: Since we are serving from single-server in this post, our configuration has to reflect that
- Logstash: We need to configure input location, grok pattern for extracting information from log. Example from here:
input {
  file {
    type => "nginx"
    start_position => "beginning"
    path => [ "/var/log/nginx/*.log" ]
  }
}

filter {
  if [type] == "nginx" {
    grok {
      patterns_dir => "/etc/logstash/patterns"
      match => { "message" => "%{IPORHOST:remote_addr} - %{USERNAME:remote_user} \[%{HTTPDATE:time_local}\] \"%{DATA:request}\" %{INT:status} %{NUMBER:bytes_sent} \"%{DATA:http_referer}\" \"%{DATA:http_user_agent}\"" }
      remove_tag => [ "_grokparsefailure" ]
      add_tag => [ "nginx_access" ]
    }

    geoip {
      source => "remote_addr"
    }
  }
}
output {
   elasticsearch {
      hosts => ["elasticsearch:9200"]
   }
}
- Kibana: Elasticsearch location has to be mentioned in configuration
Initiate setup via docker-compose
The docker compose file with required technologies is as followed:
version: "3"

services:
  elasticsearch:
    build: ./elk_elasticsearch
    ports:
      - "9200:9200"
      - "9300:9300"
    environment:
      - "discovery.type=single-node"
      - "http.cors.enabled=true"
      - "http.cors.allow-origin=*"
      - "http.cors.allow-headers=X-Requested-With,X-Auth-Token,Content-Type,Content-Length,Authorization"
      - "http.cors.allow-credentials=true"

  logstash:
    build: ./elk_logstash
    volumes:
      - ./cmn/:/trylogs
    ports:
      - "9600:9600"

  kibana:
    build: ./elk_kibana
    environment:
      ELASTICSEARCH_HOSTS: http://elasticsearch:9200
    ports:
      - "5601:5601"
Test environment setup
I prefer to test with actual domain name instead of localhost. So, please open your hosts file and add the following:
127.0.0.1 http://url.local
- Go to http://url.local:80/ --> Nginx test page should appear
- Go to http://url.local:9200/ --> Default page from Elasticsearch should appear
- Go to http://url.local:5601/ --> Kibana dashboard should appear
Afterwards, setup test-elk.yml file with the following content:
config:
  target: http://url.local/
  phases:
    - duration: 300
      arrivalRate: 10
  defaults:
    headers:
      x-api-key: "{{ $processEnvironment.SERVICE_API_KEY }}"
scenarios:
  - flow:
      - get:
          url: "/?param1=valu1"
      - get:
          url: "/?param2=valu2"
Run simulation and observe Kibana dashboard
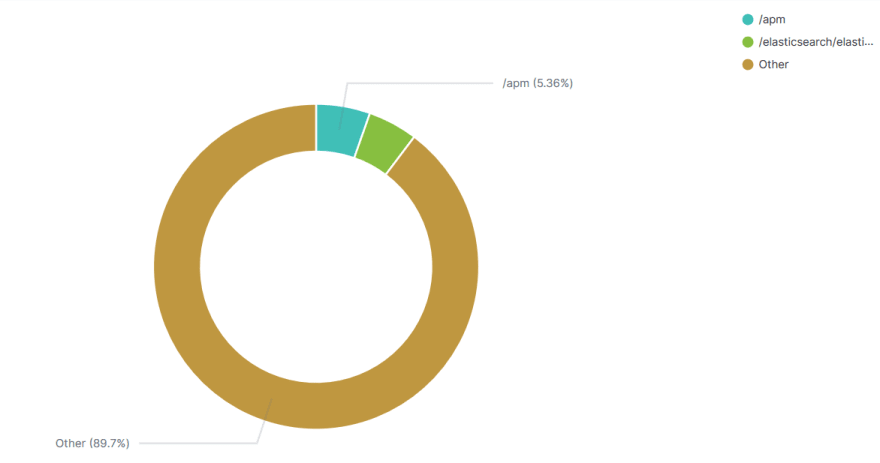
First, start artillery.io simulation using command artillery run test-elk.yml. The logstash configuration should be picking logs automatically and send to Elasticsearch. Lastly, Open kibana and create index pattern for the logs. Lastly, generate a dashboard (i.e. pie chart) like this:
Conclusion and Homework
If you have read so far, thank you :-) Now it is time for you to try additional things as homework to validate that you have understood the concept and ok with deployment approach.
I would recommend following tasks:
- In elasticsearch, I have collected only browser version. Think of other information (e.g. geocode) from the log and enhance
- Within Logstash, I have inserted the pattern inline. Try to use Grok debugger for additional usage.
- I have used pie chart as Kibana visualization object. What if I want to see a dashboard with multiple visualization for multiple analytics questions? Design this.

Top comments (0)