Quick Summary:- Have you ever wondered and tried to create a dashboard for your React application? Imagining this case, you may realize that searching for the correct data visualization tool is challenging. In this blog, we’ll figure out how you can use data visualization in your web application project?
Introduction
For building a single-page user UI-first application, React is one of the trendiest JavaScript frameworks, which is gaining popularity, and there are valid reasons for that like huge community support and interactive yet fruitful website development.
Getting started with React is easy for beginners and experienced developers. Thanks to the supportive community and detailed documentation that covers every aspect of working with React. To begin creating a web application with a high-performance presentation layer, you need basic JavaScript and HTML knowledge.
Role of React JS in Data Visualization
React works on components. Using these components, you can create modules that can be stateless and transfer the data to them with the props.
The benefit of making a React component is that it allows you to reuse the components in the same project so that it is not required to create a new component every time. With the increased technological advances and people’s enthusiasm, organizations have to be updated with people’s interests. A person can not get a significant amount of raw data to use charts and graphs, making it easy to assume the information what the data has hidden in it.
Let’s have a look at the benefits of implementing Dashboards for your business:
You can easily access your data and prioritize your actions, decisions, and tasks.
Get clear and detailed insights into your business data from the dashboard home screen by using data visualization.
Better decision-making manages the workflow and allows you to make the right call for action at the beginning of your development process.
Using an analytics dashboard, you can receive reliability that guards you when you’re taking any wrong step for your organization.
Why should you Use React.js for Data Visualization?
Boosts Productivity
Using ReactJS for data visualization boosts productivity, and enhances the capacity to reuse framework parts. For every developer, it is important to reuse the components and reemploy the digital objects.
All React components have their internal logic, making it easy for you to control and characterize them. The React community ensures to deliver a reliable application look and encourages codebase maintenance and development.
Helps in Faster Rendering
Developing React applications with excellent performance is fundamental to consider how the structure will influence the overall performance. Even the most used and recent engines fail to guarantee the absence of irritating bottlenecks by making terrible ripples to the interface.
Virtual DOM is the virtual representation of the DOM, which allows better user experience and high performance.
Ensures Stable Code
When creating a dashboard for your application, make sure that little child structure changes won’t influence the folks; ReactJS utilizes just downward data flow. The structure of data binding guarantees stable code, manages the code, and persistent application performance.
Provides the overall process of writing code
JSX is an extension syntax to JS that addresses composing your React components and sub-components a lot simpler. Follow a few easy routes for managing React elements with a couple of rules and make your source cleaner and simpler.
Provides Developer Tool Set
React Developer Tools is a browser extension which is only available for Firefox and Chrome. This tool allows you to follow reactive component hierarchies and interpret their current state and props.
ReactJS for Dashboards and Data Visualization Examples
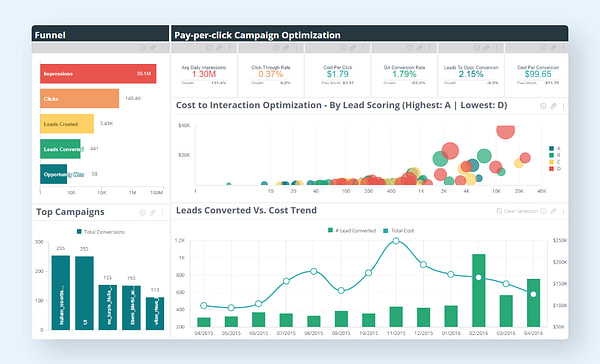
Marketing KPI Dashboard
This type of dashboards depict critical business information quickly and easily, which helps the marketing guys make immediate business decisions.
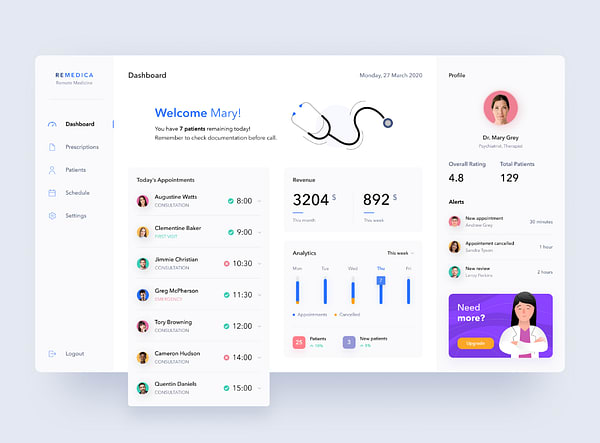
Telemedicine Dashboard
The telemedicine dashboard depicts in a raw format by implementing the best UX practices.
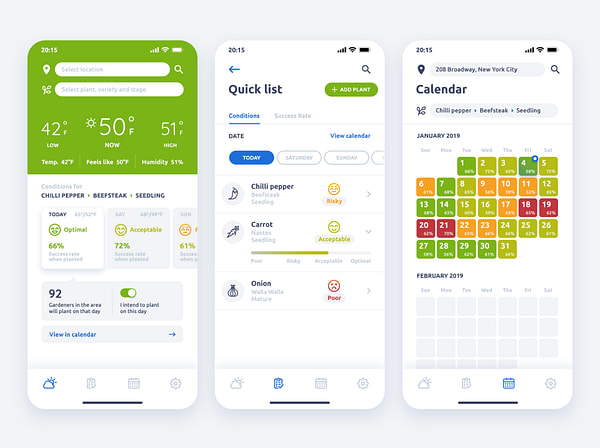
Weather App Mobile Dashboard
This type of dashboards are easy to understand the weather guiding ReactJS mobile app with flawless navigation.
ReactJS Dashboard KPIs and Metrics
Developing ReactJS Dashboard allows you to quickly peek at your business performance using the metrics and aim for long-term goals. It plays an important role in making critical decisions and expressing business needs that leverages the perks of dashboards’ data.
Business KPIs- Dashboard helps you to reduce data and determine growth, revenue, performance, and other similar metrics of your business are the key performance indicators.
High-level KPIs- It determines the evaluatory factors of your business performance.
Low-level KPIs- they are narrowed to aggregate team-wise objects, department-performance.
The monitored KPIs from ReactJS dashboards includes:
- Revenue
- Churn rate
- Growth rate
- Net profit
- Project schedule variance
Final Thoughts
ReactJS is a widely used, popular, and excellent JavaScript framework that requires impressive user interactions and crazy animations. The robust UI library helps you build a project that caters to small, medium, and large-scale organizations. ReactJS holds an extensive ecosystem of compatible add-ons, libraries, and plugins.
ReactJS for dashboard and data visualization provides numerous benefits that we discussed in this blog. I hope at the end you are aware of the importance of data visualization for your React project, so you’re now all set to take it to the next step! Hire ReactJS developers as per your business needs and evolve your business with React dashboard development.

Top comments (0)