
Project Introduction:
This End-to-End DevSecOps Project involves setting up a robust Three-Tier architecture on AWS. It aims to demonstrate the deployment of a production ready infrastructure that is secure and scalable with monitoring measures in place for application observability. It was inspired by a similar project from Aman-Pathak.
Project Overview:
- IAM User Setup: Create an IAM user on AWS with the necessary permissions to facilitate deployment and management activities.
- Infrastructure as Code (IaC): Use Terraform and AWS CLI to set up the Jenkins server (EC2 instance) on AWS.
- Jenkins Server Configuration: Install and configure essential tools on the Jenkins server, including Jenkins itself, Docker, Sonarqube, Terraform, Kubectl, AWS CLI, and Trivy.
- EKS Cluster Deployment: Utilize eksctl commands to create an Amazon EKS cluster, a managed Kubernetes service on AWS.
- Load Balancer Configuration: Configure AWS Application Load Balancer (ALB) for the EKS cluster.
- Amazon ECR Repositories: Create private repositories for both frontend and backend Docker images on Amazon Elastic Container Registry (ECR).
- ArgoCD Installation: Install and set up ArgoCD for continuous delivery and GitOps.
- Sonarqube Integration: Integrate Sonarqube for code quality analysis in the DevSecOps pipeline.
- Jenkins Pipelines: Create Jenkins pipelines for deploying backend and frontend code to the EKS cluster.
- Monitoring Setup: Implement monitoring for the EKS cluster using Helm, Prometheus, and Grafana.
- ArgoCD Application Deployment: Use ArgoCD to deploy the Three-Tier application, including database, backend, frontend, and ingress components.
- DNS Configuration: Configure DNS settings to make the application accessible via custom subdomains.
- Data Persistence: Implement persistent volume and persistent volume claims for database pods to ensure data persistence.
- Conclusion and Monitoring: Key achievements and monitoring the EKS cluster’s performance using Grafana.
Prerequisites:
An AWS account with the necessary permissions to create resources.
Terraform and AWS CLI installed on the local machine.
Basic familiarity with Kubernetes, Docker, Jenkins, and DevOps principles.
Step 1: To create an IAM user and generate the AWS Access key
Create a new IAM User on AWS and give it the AdministratorAccess for the purposes of this project (not recommended for Production Projects, always grant least privilege)
Go to the AWS IAM Service and click on Users => Create Users
- Provide the name then click next
- Select the 'Attach policies directly' option and search for 'AdministratorAccess' then select it.

Click on Create user
Now, Select your created user then click on Security credentials and generate access key by clicking on Create access key.
- Select Command Line Interface (CLI) as the Use case
- select the checkmark for the confirmation and click on Next
Add the Description tag of your choice and click on the Create access key.

Download the .csv file containing the credentials and keep in a secure location
Step 2: Install Terraform & AWS CLI to deploy the Jenkins Server(EC2) on AWS.
Install & Configure Terraform and AWS CLI on your local machine to create Jenkins Server on AWS Cloud
Terraform Installation Script
wget -O- https://apt.releases.hashicorp.com/gpg | sudo gpg - dearmor -o /usr/share/keyrings/hashicorp-archive-keyring.gpg
echo "deb [signed-by=/usr/share/keyrings/hashicorp-archive-keyring.gpg] https://apt.releases.hashicorp.com $(lsb_release -cs) main" | sudo tee /etc/apt/sources.list.d/hashicorp.list
sudo apt update
sudo apt install terraform -y
AWSCLI Installation Script
curl "https://awscli.amazonaws.com/awscli-exe-linux-x86_64.zip" -o "awscliv2.zip"
sudo apt install unzip -y
unzip awscliv2.zip
sudo ./aws/install
Now, Configure both the tools
Configure Terraform
- Edit the file /etc/environment using the below command
sudo vim /etc/environment
- add the below lines and replace the placeholders credentials with the actual your keys.
export AWS_ACCESS_KEY_ID={placeholder_key_id}
export AWS_SECRET_ACCESS_KEY={placeholder_access_key}
export AWS_DEFAULT_REGION=eu-north-1
export AWS_CONFIG_FILE="/root/.aws/config"
Save the changes and restart your machine to reflect the changes of your environment variables.
Configure AWS CLI
Run the below command, and add your keys
aws configure

Step 3: Deploy the Jenkins Server(EC2) using Terraform
Clone the Git repository - https://github.com/abdulxs/DevSecOps-Project
Navigate to the Jenkins-Server-TF
Do some modifications to the backend.tf file such as changing the bucket name and dynamodb table(make sure you have created both manually on AWS Cloud - Ensure the 'Lock-files' table has a partition key named 'LockID' of type string).

On the variables.tfvars file, replace the key name with the Pem File name you have created on AWS. (If you have not, create a new one)

Validate that the provider.tf and vpc.tf files also have the correct aws region set.
Initialize the backend by running the below command in the /Jenkins-Server-TF directory
terraform init

Run the below command to check the syntax error
terraform validate

Run the below command to get the blueprint of what AWS services will be created.
terraform plan -var-file=variables.tfvars

Now, run the below command to create the infrastructure on AWS Cloud which will take 3 to 4 minutes maximum
terraform apply -var-file=variables.tfvars --auto-approve

Now, connect to the Jenkins-Server from AWS console by clicking on Connect.

You can use ec2 instance connect or copy the ssh command to connect from your local machine (don't forget to add your key name)
Step 4: Configure the Jenkins
Now, we log into the Jenkins server.
We have installed services such as Jenkins, Docker, Sonarqube, Terraform, Kubectl, AWS CLI, and Trivy from the tools-install.sh file.
Let’s validate their installation.
jenkins --version
docker --version
docker ps
terraform --version
kubectl version
aws --version
trivy --version
eksctl version

Now, to configure Jenkins. Copy the public IP of the Jenkins Server and paste it on the browser with an 8080 port.

Locate the password as directed. Enter it and proceed
Click on Install suggested plugins
After installing the plugins, continue as admin.

Click on Save and Finish. Click on 'Start using Jenkins'.
Then you should see the Jenkins Dashboard

Step 5: Deploy the EKS Cluster using eksctl commands
Now, go back to your Jenkins Server terminal and configure AWS with the command aws configure.
Go to Manage Jenkins. Click on Plugins.
Select the 'Available plugins', install the following plugins and click on Install
AWS Credentials
Pipeline: AWS Steps

Once, both the plugins are installed, restart your Jenkins service by checking the Restart Jenkins option.

Login to the Jenkins Server Again

Now, we have to set the AWS credentials on Jenkins
Go to Manage Plugins and click on Credentials

Click on global.

Click on 'add credentials'
Select AWS Credentials as Kind and add the ID same as shown in the below snippet except for your AWS Access Key & Secret Access key and click on Create.

Now, We need to add GitHub credentials as well.
So, add the username and password/access token of your GitHub account.

Create an eks cluster using the below commands.
eksctl create cluster --name Three-Tier-K8s-EKS-Cluster --region eu-north-1 --node-type t3.medium --nodes-min 2 --nodes-max 2
aws eks update-kubeconfig --region eu-north-1 --name Three-Tier-K8s-EKS-Cluster

Once your cluster is created, you can validate whether your nodes are ready or not by the below command
kubectl get nodes

Step 6: Configure the Load Balancer on the EKS because the application will have an ingress controller.
Download the policy for the LoadBalancer prerequisite.
curl -O https://raw.githubusercontent.com/kubernetes-sigs/aws-load-balancer-controller/v2.5.4/docs/install/iam_policy.json
![]()
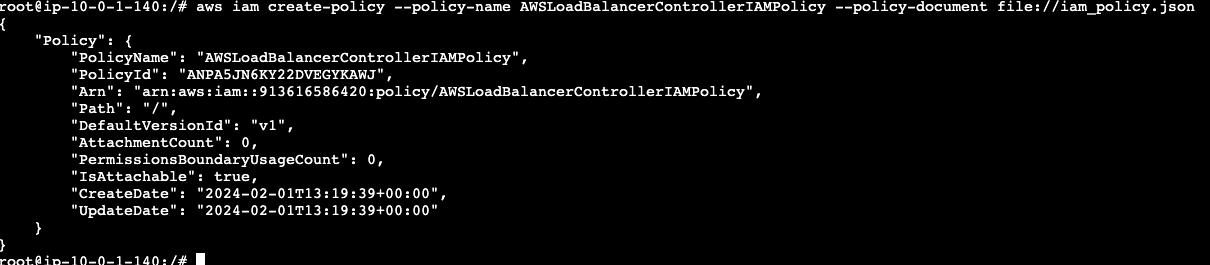
Create the IAM policy using the below command
```aws iam create-policy --policy-name AWSLoadBalancerControllerIAMPolicy --policy-document file://iam_policy.json
Create OIDC Provider
```eksctl utils associate-iam-oidc-provider --region=eu-north-1 --cluster=Three-Tier-K8s-EKS-Cluster --approve```

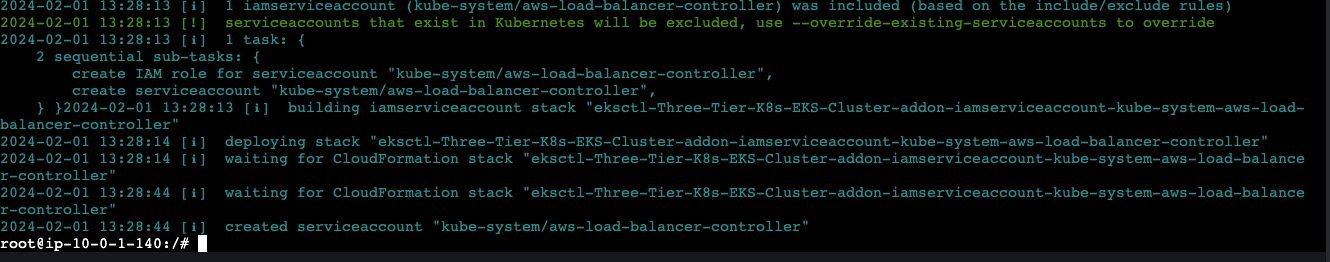
Create Service Account (replace the account ID with yours)
```eksctl create iamserviceaccount --cluster=Three-Tier-K8s-EKS-Cluster --namespace=kube-system --name=aws-load-balancer-controller --role-name AmazonEKSLoadBalancerControllerRole --attach-policy-arn=arn:aws:iam::{account ID}:policy/AWSLoadBalancerControllerIAMPolicy --approve --region=eu-north-1```
Run the below command to deploy the AWS Load Balancer Controller
```sudo snap install helm --classic
helm repo add eks https://aws.github.io/eks-charts
helm repo update eks
helm install aws-load-balancer-controller eks/aws-load-balancer-controller -n kube-system --set clusterName=my-cluster --set serviceAccount.create=false --set serviceAccount.name=aws-load-balancer-controller```
After 2 minutes, run the command below to check whether the pods are running or not.
```kubectl get deployment -n kube-system aws-load-balancer-controller

Step 7: Create Amazon ECR Private Repositories for both Tiers (Frontend & Backend)
Go to Amazon Elastic Container Registry on the AWS console and click on Create repository

Select the Private option and provide the repository name 'frontend'. click Save.
Do the same for the backend repository and click on Save

We have set up our ECR Private Repositories
Now, we need to configure ECR locally because we have to upload our images to Amazon ECR.
Open the repository, view push command and copy the first push command for login
Now, run the copied command on the Jenkins Server.

Step 8: Install & Configure ArgoCD
We will be deploying the application in a namespace called 'three-tier'. To do that, we will create the namespace on EKS
kubectl create namespace three-tier

The two ECR repositories are private. So, when we try to push images to the ECR Repos it will give an 'Imagepullerror' error.
To avoid this error, we will create a secret for our ECR Repo with the below command and then, we will add this secret to the deployment file.
Note: The Secrets are coming from the .docker/config.json file which is created while logging in the ECR in the earlier steps
kubectl create secret generic ecr-registry-secret \
 --from-file=.dockerconfigjson=${HOME}/.docker/config.json \
 --type=kubernetes.io/dockerconfigjson --namespace three-tier
kubectl get secrets -n three-tier

Now, we will install argoCD.
To do that, create a separate namespace for it and apply the argocd configuration for installation.
kubectl create namespace argocd
kubectl apply -n argocd -f https://raw.githubusercontent.com/argoproj/argo-cd/v2.4.7/manifests/install.yaml

All pods must be running, to validate run the below command
kubectl get pods -n argocd

Now, expose the argoCD server as a LoadBalancer using the below command
kubectl patch svc argocd-server -n argocd --type='json' -p='[{"op":"replace","path":"/spec/type","value":"LoadBalancer"}]'’
![]()
You can validate whether the Load Balancer is created or not by checking on the AWS Console => EC2 => Load balancers

To access the argoCD, copy the LoadBalancer DNS and access the url on the browser
You will get a warning like the below snippet.
Click on Advanced.

Click on the link that appeared below it to proceed

Now, we need to get the password for our argoCD server to perform the deployment.
To do that, we have a pre-requisite which is jq. Install it with the command below.
sudo apt install jq -y

export ARGOCD_SERVER=$(kubectl get svc argocd-server -n argocd -o jsonpath='{.status.loadBalancer.ingress[0].hostname}')
export ARGO_PWD=$(kubectl -n argocd get secret argocd-initial-admin-secret -o jsonpath="{.data.password}" | base64 -d)
echo $ARGO_PWD

Enter the username and password in argoCD and click on SIGN IN.

Here is the ArgoCD Dashboard.

Step 9: To configure Sonarqube for the DevSecOps Pipeline
Copy the Jenkins Server public IP and paste it in the browser with a 9000 port
The username and password will be 'admin'
Click on Log In.

Update the password and login

Click on Administration then Security => select Users => Update tokens

Click on Generate

Copy the token keep it somewhere safe and click Done.

Now, we have to configure webhooks for quality checks.
Click on 'Administration' then, 'Configuration' and select 'Webhooks'

Click on Create
Provide the name of the server and in the URL, provide the Jenkins server public IP with port 8080. Add sonarqube-webhook in the suffix, and click on Create.
http://:8080/sonarqube-webhook/

Now, we have to create a Project for frontend code.
Click on 'Manually'.

Provide the display name to the Project and click on Setup

Click on 'Locally'.

Select the 'Use existing token' and click on Continue.
Put in the token generated earlier and continue

Select 'Other' and 'Linux' as OS.
After performing the above steps, you will get the command which you can see in the below snippet.
Now, use the command in the Jenkins Frontend Pipeline where Code Quality Analysis will be performed.

Now, we have to create a Project for backend code.
Click on 'Create Project' and repeat similar steps as done for the frontend project to create the backend equivalent.
Once done, we have to store the sonar credentials.
Go to Dashboard -> Manage Jenkins -> Credentials
Select the kind as 'Secret text', paste your token in 'Secret' and keep other things as is.
Click on Create

Now, we have to store the GitHub Personal access token to push the deployment file which will be modified in the pipeline itself for the ECR image.
Add GitHub credentials on Jenkins
Select the kind as 'Secret text' and paste your GitHub Personal access token(not password) in 'Secret', and keep other things as is.
Click on Create
Note: If you haven’t generated your token then, you have it generated first then paste it into the Jenkins credentials.
Now, according to the Pipeline, we need to add an Account ID in the Jenkins credentials because of the ECR repo URI.
Select the kind as Secret text paste your AWS Account ID in Secret and keep other things as it is.
Click on Create.
Now, we need to provide the ECR image name for frontend which is 'frontend' only.
Select the kind as 'Secret text', paste the frontend repo name in 'Secret' and keep other things as is.
Click on Create

Now, we need to provide the ECR image name for the backend which is 'backend' only.
Select the kind as 'Secret text', paste the backend repo name in 'Secret', and keep other things as is.
Click on Create

Final Snippet of all Credentials needed.

Step 10: Install the required plugins and configure the plugins to deploy the Three-Tier Application
Install the following plugins by going to Dashboard -> Manage Jenkins -> Plugins -> Available Plugins
Docker
Docker Commons
Docker Pipeline
Docker API
docker-build-step
Eclipse Temurin installer
NodeJS
OWASP Dependency-Check
SonarQube Scanner
To configure the installed plugins.
Go to Dashboard -> Manage Jenkins -> Tools
- To configure jdk
Search for 'jdk' and provide the configuration as in the below snippet.

- To configure the sonarqube-scanner
Search for the sonarqube scanner and provide the configuration like the below snippet.

- Next is to configure nodejs
Search for node and provide the configuration like the below snippet.

- Next is to configure the OWASP Dependency check
Search for Dependency-Check and provide the configuration like the below snippet.

- To configure docker
Search for docker and provide the configuration like the below snippet.

Next is to set the path for Sonarqube in Jenkins
Go to Dashboard -> Manage Jenkins -> System
Search for SonarQube installations
Provide the name as it is, then in the Server URL copy the sonarqube public IP (same as Jenkins) with port 9000 select the sonar token that we have added recently, and click on Apply & Save.

Now, we are ready to create our Jenkins Pipeline to deploy the Backend Code.
Go to Jenkins Dashboard
Click on 'New Item'
Provide the name of the Pipeline and click on OK.

This is the Jenkins file to deploy the Backend Code on EKS.
Copy and paste it into the Jenkins
https://github.com/abdulxs/DevSecOps-Project/blob/master/Jenkins-Pipeline-Code/Jenkinsfile-Backend
Click Apply & Save.

Now, click on the build.
The pipeline was successful after troubleshooting some errors.
Note: Make changes in the Pipeline according to your project.

Now, we create the Jenkins Pipeline to deploy the Frontend Code.
Go to Jenkins Dashboard
Click on 'New Item'
Provide the name of the Pipeline and click on OK.

This is the Jenkins file to deploy the Frontend Code on EKS.
Copy and paste it into the Jenkins
https://github.com/Abdulxs/DevSecOps-Project/blob/master/Jenkins-Pipeline-Code/Jenkinsfile-Frontend
Click Apply & Save.

Now, click on the build.
The pipeline was successfully run.
Note: Make changes in the Pipeline according to your project.

Step 10: Set up Monitoring for the EKS Cluster for observability
We will achieve the monitoring using Helm.
Add the prometheus repo by using the below command
helm repo add stable https://charts.helm.sh/stable
helm repo add prometheus-community https://prometheus-community.github.io/helm-charts

Install the prometheus
helm install stable prometheus-community/kube-prometheus-stack
Now, check the service with the below command
kubectl get svc

Next is to access the Prometheus and Grafana consoles from outside of the cluster.
For that, we need to change the Service type from ClusterType to LoadBalancer
Edit the stable-kube-prometheus-sta-prometheus service
kubectl edit svc stable-kube-prometheus-sta-prometheus
Modify the 48th line from ClusterType to LoadBalancer

Edit the stable-grafana service
kubectl edit svc stable-grafana
Modify the 39th line from ClusterType to LoadBalancer

Now, if you list again the service then, you will see the LoadBalancers DNS names
kubectl get svc

You can also validate from the console.

Now, to access the Prometheus Dashboard
Paste the :9090 in the browser and you will see like this

Click on Status and select Target.
A lot of Targets will show up on the page.

To access the Grafana Dashboard
Copy the ALB DNS of Grafana and paste it into the browser.
The username will be 'admin' and the password will be 'prom-operator' for the Grafana LogIn.

Next, click on Data Source

Select Prometheus
In the 'Connection', paste your :9090.

A correct URL will see result in a green notification.
Click on Save & test.

Now, we will create a dashboard to visualize our Kubernetes Cluster Logs.
Click on Dashboard.
Once you click on Dashboard. You will see a lot of Kubernetes components monitoring.

A certain type of Kubernetes Dashboard will be imported.
Click on New and select Import

Provide '6417' ID and click on Load
Note: 6417 is a unique ID from Grafana which is used to Monitor and visualize Kubernetes Data

Select the data source that you have created earlier and click on Import.

Now we can view the visualized Kubernetes Cluster Data.

Step 11: Deploy the Three-Tier Application using ArgoCD.
As the repository is private. So, we need to configure the Private Repository in ArgoCD.
Click on Settings and select Repositories

Click on 'CONNECT REPO USING HTTPS'

Next, provide the repository name where the Manifest files are present.
Provide the username and GitHub Personal Access token and click on CONNECT.

The Connection Status is Successful.

Next, create the first application which will be a database.
Click on 'CREATE APPLICATION'.

Provide the details as it is provided in the below snippet and scroll down.

Select the same repository that was configured in the earlier step.
In the Path, provide the location where the Manifest files are present and provide other details as shown in the below screenshot.
Click on CREATE.

While the database Application is starting to deploy, We will create an application for the backend.
Provide the details as provided in the below snippet and scroll down.

Select the same repository as configured in the earlier step.
In the Path, provide the location where the Manifest files are present and provide other details as shown in the below screenshot.
Click on CREATE.

While the backend Application is starting to deploy, We will create an application for the frontend.
Provide the details as provided in the below snippet and scroll down.

Select the same repository as configured in the earlier step.
In the Path, provide the location where the Manifest files are present and provide other details as shown in the below screenshot.
Click on CREATE.

While the frontend Application is starting to deploy, We will create an application for the ingress.
Provide the details as it is provided in the below snippet and scroll down.

Select the same repository as configured in the earlier step.
In the Path, provide the location where the Manifest files are present and provide other details as shown in the below screenshot.
Click on CREATE.

Once the Ingress application is deployed, it will create an Application Load Balancer.
You can validate this as the load balancer named k8s-three on the console.

Now, Copy the ALB-DNS and go to the Domain Provider; in my case Hostinger is the domain provider.
Create a CNAME record for the ALB-DNS.
Note: The subdomain in use here is backend.lagbaja.tech
All 4 application deployments are now successful

Now we can try to access the application from the browser

We explore the Grafana Dashboard to view the EKS data such as pods, namespace, deployments, etc

This is the Ingress Application Deployment in ArgoCD

This is the Frontend Application Deployment in ArgoCD

This is the Backend Application Deployment in ArgoCD

This is the Database Application Deployment in ArgoCD

As observed, Persistent Volume & Persistent Volume Claim have been configured. So, if the pods get deleted, the data won’t be lost. The Data will be persisted on the host machine.
Conclusion:
In this comprehensive DevSecOps Kubernetes project, the following have been achieved:
- Established IAM user and Terraform for AWS setup.
- Deployed Jenkins on AWS, configured tools, and integrated it with Sonarqube.
- Set up an EKS cluster, configured a Load Balancer, and established private ECR repositories.
- Implemented monitoring with Helm, Prometheus, and Grafana.
- Installed and configured ArgoCD for GitOps practices.
- Created Jenkins pipelines for CI/CD, deploying a Three-Tier application.
- Ensured data persistence with persistent volumes and claims.
Clean up Resources
Run Terraform destroy and go to the AWS console to delete other resources created to avoid incurring extra costs.
Delete ECR repo, dynamodb table, the EKS nodegroup, eks cluster, nat gateway. Detach and delete network interfaces,
delete vpc, security groups, load balancers and other resources.


Top comments (0)