Vijith Nair
The power of data is what makes it possible for companies to come up with successful new products in this day and age of accelerating dynamism. Data-based insights have changed how we view product development by enabling us to leverage the use of big data. There is no longer decision making without thought in the world of product analytics. However, they are not based on blind guesswork but rather informed by a solid grasp of user habits, likes, and market dynamics. This is taking us into a world in which data informs every part of the product life cycle from conception through optimisation, resulting in both innovation and quality.
The purpose of this article is to guide you through the comprehension of Product Analytics and how it impacts modern product engineering. Understandably, we shall discuss data as an integral part of the decision-making, distinguish between qualitative and quantitative analysis and how their combination makes sense. We’ll be understanding the importance of Product Analytics on improving user experience, prioritizing the features and personalizing content. This article will also consider the changes developing in this area, stressing on the combination of qualitative methods with quantitative methods.
So, fasten your seatbelts and get ready to embark on a data-driven adventure that will unveil the power of Product Analytics and equip you with the tools to create innovative, user-centric, and successful products. Your journey begins now.
But….
Product analytics is a very broad and complex topic. So, let’s strip it down to its fundamentals. Like Michael Jordan once said — “Get the fundamentals down and the level of everything you do will rise.”
When one of the most successful athletes of all time — a person who has amassed over $3 billion net worth talks, you listen. And when a person has researched enough to write 5000 words on something, you read. That’s not to say that both people are comparable, but hey — just read.
Product
Now that we’re breaking down things, let’s do it in a way that’s not like reading a dry dictionary definition.
Product — Think of it as something you encounter every day, possibly even before you’ve fully opened your eyes in the morning. Your alarm clock, for instance. That’s a product! It’s that gadget that plays your most annoying ringtone, ensuring you wake up to face the day, and also the one you’ve contemplated tossing out the window more than once.
Here are some more examples to really nail the point — a hammer (a great tool to nail things in), your toothbrush — a reliable little tool that helps you battle against dental woes or even the smartphone you’re probably reading this on. All of these — products. In essence, a product is any tangible or intangible thing that someone, somewhere, has designed, developed, and offered for your use or consumption. Products can range from physical goods like smartphones and clothing to digital offerings such as software applications and online platforms.
Analytics
Do you like pizza, dear reader? For the sake of this example, let’s just say that you do. Now let’s assume that you’re inherently indecisive and can’t make up your mind on what kind of pizza you want to order. So, you take a survey of your friends’ pizza preferences. The information you gain from them is the data. Next, you look at all the data, process it, and that tells you what the most preferred option among your friends is. Now you know exactly what to order to please the crowd. That’s analysis. Analytics is taking that pile of data and turning it into a clear direction.
Think of analytics as an instruction manual for understanding data. It is the systematic process of collecting, processing and interpreting data to gain insights and make informed decisions. Analysis of something may involve using various tools, techniques, and methods to extract meaningful information from raw data. It is omnipresent. It is field agnostic. It can be applied in a wide array of fields, such as business, healthcare, sports, and more. Analytics help in gaining a deep understanding of topics to drive improvements and optimize outcomes.
What is product analytics?
You have a product. You have analytics. Uhh.. Product analytics.
What exactly is “product analytics”? In a sentence — it helps peel back the layers to reveal insights about your product’s performance and user behavior. It’s your view that’ll allow you to scrutinize your creation, understand how users interact with it, what makes them tick, and what leaves them scratching their heads.
In essence, product analytics is the art and science of collecting, processing and scrutinizing data to decipher how your product is faring in the wild. It’s your window into what your users love, what they find frustrating, and how they navigate your product.
Product analytics allows you to answer the “what” and “why” questions that hover around your product. First, it tells you what’s happening. For instance, you can find out which features are getting all the love, where users get stuck, and how long they linger on your website or app. It’s all about the cold, hard data that presents you with the facts.
That’s just half the story though. The magic of product analytics is when it takes you from the “what” to the “why.” For example, you might know that users drop off during the checkout process, but product analytics goes way further. It can pinpoint if the issue is a cumbersome form or a confusing payment gateway. This “why” aspect of product analytics lets you fix what’s not working, optimize what’s promising, and create a user experience that makes your product worth the try.
Let’s take a short break here to explore an example where I’ll urge you to tap into your imagination -
You’re an online store owner in this scenario. If I were to draw parallels between a brick-and-mortar store and your online one, I’d say — product analytics is your store manager, your security camera, and your customer service rep all rolled into one. It tracks what your customers look at, what they pick up, and what they put back. It shows you which aisles they linger in and which ones they rush through.
The observation is data and the interpretation of said data is product analytics. Product analytics doesn’t just tell you that customers abandon their carts; it tells you whether it’s due to high shipping costs, a confusing checkout process, or unexpected surprises at the last click. This means you don’t just see what’s happening; you understand why it’s happening.
All of this helps you optimize for the best performance and user experience. So basically, product analytics helps you refine your store layout, making it easier for customers to navigate.
Interested in analyzing your digital products? Try Zipy and understand your user behavior in and out.
The evolution of product analytics
Now that we’ve used the break, I reckon we get into gear and start the car. But this car doesn’t go forward. Not yet, at least. We are in the DeLorean that is going to travel back in time.
Back in the day (well, not too long ago), product development was like a blindfolded game of darts. And if you are anything like me, already handicapped with innate inaccuracy, you’d stand no chance. You’d throw features at the board and hope something stuck. Hope can only get you so far though. Not the best strategy, eh?
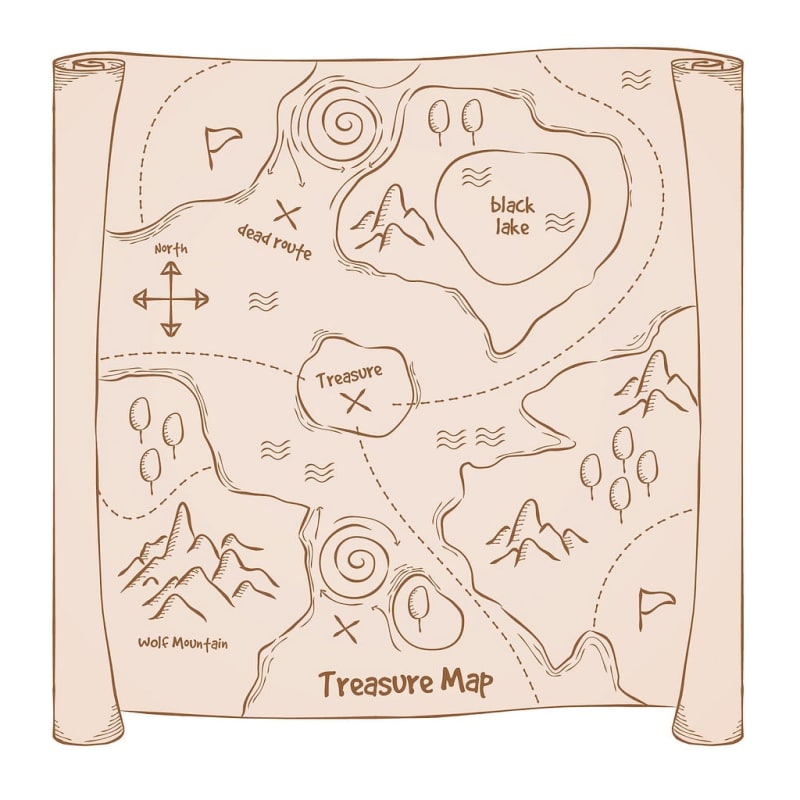
That’s when the hero of our story — product analytics, entered the scene. Suddenly, you had data on your side. No more wild guesses, just cold, hard numbers. Imagine being handed a treasure map with a big “X” marking the spot. That’s what product analytics did — it showed you where the gold (or in this case, user engagement) was hiding.
Historically, it all started with basic web analytics — page views, clicks, and bounce rates. People wanted to know not just what users were doing and why they were doing it. This added a layer of user behavior, feedback, and context to the mix.
Then the internet expanded faster than your holiday waistline and so did the need for more advanced Product Analytics. The field evolved really fast to keep up. Enter session replays, A/B testing, cohort analysis, and event tracking. Now, not only could you see what was happening, but you could experiment with different features, analyze user segments, and track specific interactions. The product development process was becoming a science. No more was it a darts in the dark situation.
Today Product Analytics is extremely sophisticated. It combines the best of both worlds — quantitative data for the “what” and qualitative data for the “why.” Like peanut butter and jelly, Batman and Robin, or Netflix and chill — they just go together.
So, here’s the deal — Product Analytics has taken us from blindly navigating to having a GPS with voice-guided directions. The journey so far has been exciting, and the future? It promises to be bright too.
The core components of product analytics
Quantitative product analytics
Quantitative data is like that book for product development. It’s all about numbers, and those numbers can reveal hidden flavors in your product.
Significance? Oh, it’s huge! You get to measure the “what” of your product’s performance. We’re talking about metrics like conversion rates, user engagement, and user churn. This data paints a picture, and it’s up to you to decipher it.
You will generate a lot of quantifiable data when you start tracking your product, its users and their engagement properly. The quantitative aspect of product analytics offers a numbers-driven perspective. Quantitative analytics is characterized by hard data, key metrics, and statistical analysis.
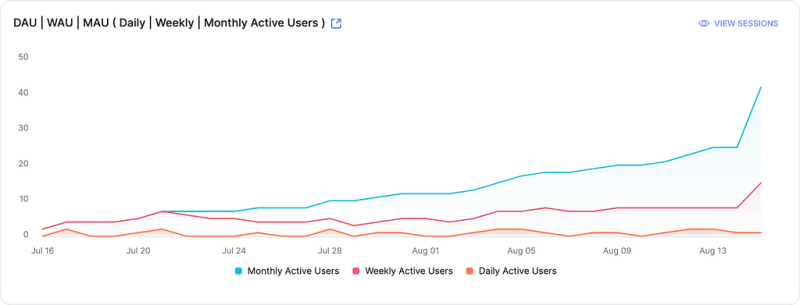
Besides the data, you would also require an aggregate of how healthy your product is. Like a compass for navigation, product managers rely on these high-level views of key metrics to steer their product strategy. Some of these metrics could be the number of users acquired, engaged, retained, or contributing positively towards revenue. They help you understand if you’re on the right course or if you need to adjust your sails. Quantitative analytics offers a clear view of how users interact with your product, where they drop off, what they click on, and what keeps them coming back.
Below are some methods of quantitative analysis:
- Metrics & KPIs are your product’s vital signs. Metrics offer snapshots of how your product is performing, while KPIs act like a compass guiding your critical objectives.
- User behavior analysis helps you understand how users interact with your product, tracking clicks, page views, and feature usage.
- Conversion Funnel Analysis visualizes the steps users take, revealing drop-off points and insights for optimization.
- A/B testing is about pitting two product versions against each other to fine-tune interfaces, features, or marketing strategies.
Qualitative product analytics
While quantitative product analytics excels in numbers and statistical precision, it often fails to address a key aspect in the shadows — the ‘why’ behind the data. Qualitative product analytics are essential here because they help interpret the human experience within your product.
Qualitative data provides depth and context. It’s like having a conversation with your customers on a massive scale.
With quantitative data, you know the “what” — what users are doing. But with qualitative data, you discover the “why” — why they’re doing it. This insight is invaluable. It helps you understand the pain points, preferences, and desires of your users. Armed with this knowledge, you can fine-tune your product.
Some methods of qualitative analysis are as follows:
- User feedback and surveys are like having a group chat with users to know their thoughts, concerns, and ideas. It’s a direct line to understanding their needs and desires.
- User interviews are one-on-one heart-to-hearts with users. You ask open-ended questions, allowing users to share their experiences in their own words. It’s all about delving deep into individual stories.
- Usability testing is like hosting a focus group in your living room to observe how they interact with your product. Participants engage with your product while you watch and take notes.
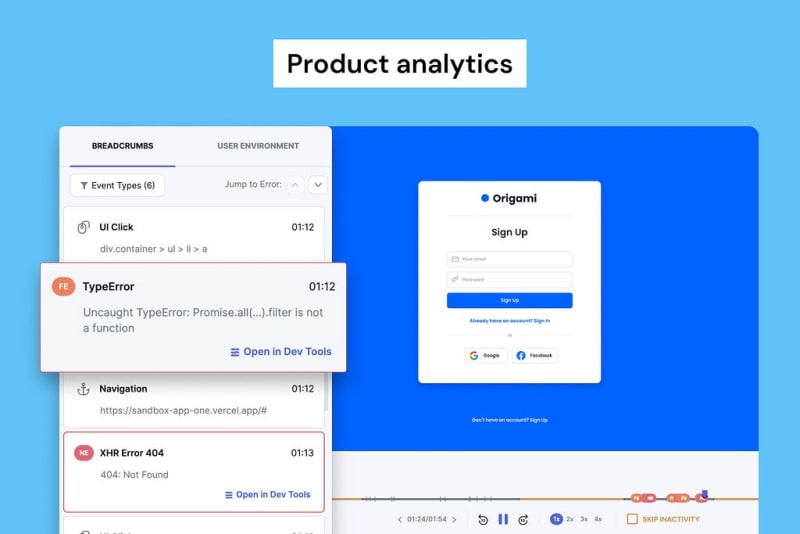
- Session recordings are like using a DVR to playback user sessions. You can rewatch user interactions to see exactly where they click, pause, or get a bit lost in your product’s landscape.
User experience analytics
Why do we do all these analysis? It is to make sure your users stick around. What will make them a regular user is a great experience. This calls for an argument that this type of analytics might be one of the most important ones. UX analytics is about making sure your product doesn’t feel like a mysterious puzzle to your users. It is the key to ensuring your product meets users’ needs without leaving them scratching their heads.
Some great UX analysis methods to explore would be -
- Usability testing: Think of usability testing as a way to put your product to the test. You observe real users interacting with your product, just like a chef watches people taste their dishes. This process reveals what’s delightful and what needs improvement. It’s all about fine-tuning your creation.
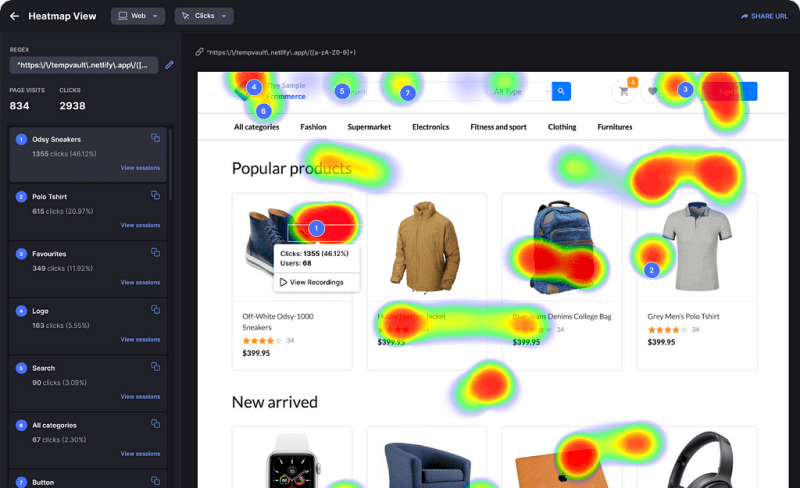
- Heatmaps: Heatmaps are your X-ray vision into user behavior. They show you where users are focusing their attention on your website or app. You can pinpoint which features are drawing the most interest and which areas need some work. It’s not a game of hide and seek; it’s a serious tool for understanding user engagement.
- User flow analysis: If your product were a river, user flow analysis would be your map of its twists and turns. It’s like being an investigator, except you’re solving the mystery of why users drop off before completing a specific action. User flow analysis identifies the obstacles and inefficiencies in the user journey, making sure it’s a smooth ride.
In short, UX analytics is the spotlight on the stage of user experience. It reveals what’s effective and what’s not. It allows you to refine your product until it’s as polished as a finest of gemstones. It’s the secret that keeps your users coming back for more and, just maybe, turning them into your product’s biggest fans.
Explore user experience tools for user research, user journey mapping, and analytics.
The role of product analytics in product development
Product development is an ever-evolving journey. Some might say it is a nuanced dance between the allure of innovation and the super-important user satisfaction. When confused between the two, product analytics can be the guiding light directing the course. Safe to say that analytics plays a pivotal role in steering the course of product development.
Imagine a fitness app with a lot of users. A lot of users also directly translates to a ton of user engagement data. Analytics will help identify patterns and anomalies in the user journey. In one such instance, you discover a substantial drop-off in user activity after a specific workout session. Now this revelation could become the catalyst for innovation — a spark that ignites the creation of a new feature — personalized workout recommendation system.
The data uncovered through analytics isn’t just a collection of numbers; it forms a narrative, a story of user behaviors, preferences, and pain points. Product development teams utilize this data as a compass to steer their product strategy. In the previous example, the drop-off after the workout session wasn’t just a statistic; it’s a signpost pointing towards an opportunity to enhance user engagement. Such pivotal moments of insights usually transform into a new feature — like the personalized workout recommendation system. Now, users not only exercise but receive tailored suggestions based on their preferences and past activities. The app that was just an app becomes something more. Now you can market it as a “personalized fitness companion,” that adapts and evolves with the user’s journey.
Real examples of data-driven excellence:
Hypotheticals are fine, but I think relating this to something that you experience everyday will really bring the point home. So, here are some of your mankind’s most-used products in recent history -
Spotify’s discover weekly: Isn’t Spotify the best at personalized music streaming? I’d say it is. It leverages user listening habits. By analyzing what users enjoy, the platform curates a weekly playlist — Discover Weekly. This isn’t just a random selection; it’s a data-driven feature that keeps users engaged by introducing them to new music aligned with their tastes.

Google maps traffic predictions: Ever wondered how Google Maps predicts traffic conditions? That too is data analytics. By studying the movement patterns of users, Google provides real-time traffic predictions, helping users navigate efficiently. This data-driven feature is another solid testament to how analytics enhances user experience.

Amazon’s recommendation engine is a beacon of data-driven personalization. Analyzing purchase history, browsing behavior, and demographic data — Amazon suggests products tailored to individual interests. This not only drives sales but also enhances user satisfaction, turning browsing into a personalized and delightful shopping journey.
Creating user-centric designs with product analytics
User-centric design is the North Star guiding every decision, every pixel, and every interaction in product development. Product analytics has played a pivotal role over the years in the transformation from intuition-driven design to a user-preference-based designs
In the bygone era, before the rise of comprehensive product analytics, design decisions were like navigating in the dark with only intuition as a guide. Designers relied on gut feelings, past experiences, and personal preferences to shape the aesthetics and functionality of a product. However, this approach, while sincere, lacked the precision and insights necessary to truly understand user behavior and preferences.
Product analytics changed all of this, and the design landscape undeunder went a revolutionary shift. Designing for users is no longer a blindfolded venture; it’s a process that involves understanding their preferences. Every interaction, every visual element, and every user journey is now under the scrutiny of data-driven insights.
Integrating quantitative, qualitative and user experience analytics
The integration of quantitative, qualitative, and user experience analytics is the key to design precision. This integration transcends aesthetics. It goes beyond the mere pursuit of aesthetically pleasing interfaces; this integration is the key to crafting an immersive experience that aligns seamlessly with users’ needs and preferences. At its core, this ensures that design decisions are not whimsical intuitions but thoughtful improvements backed by concrete evidence.
Although aesthetics play a crucial role in design, the integrated approach of product analytics aims for something that goes beyond the visual allure. It delves really deep into the intricacies of user interactions, sentiments, and the overall journey through a product. The goal is not just to make things look good but to make them function according to user’s expectations and behaviors. There’s no point in owning a devilish Lamborghini if you don’t know how to drive.
The desired outcome of the integration of quantitative, qualitative, and user experience analytics, product analytics is to craft experiences that resonate with users on a profound level. There is an added importance given to understanding the nuanced preferences and pain points of users. Design decisions, guided by this integration, become a form of art — a thoughtful composition that speaks directly to the users’ hearts.
The integration of these analytics approaches signifies a paradigm shift in the world of design. As discussed before, it moves the needle from relying solely on intuition to embracing the precision of data-backed insights. Product analytics, standing at the forefront of this evolution, leads the way into a future where user-centric design resonates with perfection, if there is such a thing.
Analyze both quantitative and qualitative data with Zipy and ensure your apps have a great digital experience.
Innovation in product analytics
Product analytics is a realm where insights are the currency and innovation is the anthem. There has been a lot of focus on both these aspects in recent times which has led to a number of tools emerging in the market. You have tools that do quantitative product analytics — the ones that give you hard numbers. Then there are also qualitative product analytics tools that offer the ability to understand users better. However, this is all still fragmented. That was until Zipy — a comprehensive, all-in-one analytics solution designed to redefine the way you harness data. The next part of this article explores Zipy’s powerful product analytics platform, dissecting its key features, and understanding the functionalities that set it apart in the crowded arena of analytics solutions.
More than just product analytics
At its core, Zipy is not just another product analytics tool, it is much more. It is the co-pilot in your journey to understand and enhance your product. It’s your digital assistant, tirelessly offering you data that ensures your product not only performs well but also delivers an exceptional user experience.
There are a lot of things that make Zipy the complete solution for your product analytics that it is. Here are some of the things that makes it a standout -
- Error monitoring : Safeguarding yourself against glitches and hiccups in your product becomes easier. Spot errors and provide a detailed analysis of their impact. It’s like having a personal troubleshooter.
- Real-time analytics : In a world that moves at the speed of thought, real-time analytics is not a luxury but a necessity. Zipy provides insights in the blink of an eye. This real-time capability is not just about reacting swiftly to issues; it’s about seizing opportunities as they show up.
- Session replays : We’ve all wished we could peek over our users’ shoulders while they navigate the product, right? Just me? Anyways, with session replays you can actually do it. Sorta. It’s the digital equivalent of having a front-row seat to understand exactly how users interact with your product.
- User segmentations: Every user is unique, and it is important to recognize that. Zipy allows you to segment your user base based on various characteristics and behaviors. Easily focus on different user personas, thus tailor your product to diverse needs.
- Advanced filtering : Fish out exactly what you need in a sea of data. Advanced filtering is your precision rod, allowing you to sift through data effortlessly. Explore the insights that are most relevant to you.
- Product analytics : Zipy is not just about numbers; it’s about meaningful analytics that guide your decisions. It provides a comprehensive view of user engagement, feature adoption, and areas for improvement. It’s a strategic map for your product.
Beyond these, what sets Zipy apart is the holistic experience it offers. It’s not just a tool; it’s a philosophy that revolves around the continuous improvement of your product. Zipy is designed to be intuitive, user-friendly, and deeply insightful. It’s not about drowning you in data; it’s about presenting information in a way that sparks “Aha!” moments to propel your product forward. It’s about — fixing what matters!
Remember the part where I said Zipy is like a co-pilot? Well, it’s a co-pilot in a cockpit full of dials and buttons. It not only tells you about the altitude and speed but also spots turbulence ahead of time and suggests smoother routes. It is all about the process of refining, optimizing, and perfecting your product.
Now, you might wonder, “Why choose Zipy among the plethora of product analytics platforms?” Firstly, how are you still wondering after the last few paragraphs? Secondly, here’s why -
The answer lies in its seamless integration of powerful features with a user-centric approach.
It transforms raw data into actionable insights.
It is not just a tool for product teams; it’s for every creator, entrepreneur, and innovator who wants to understand their product and their audience better.
It is the perfect compass guiding your product strategy, the flashlight revealing hidden insights, and the mirror reflecting the true impact of your innovations.
Take your product analytics a notch up with Zipy. Optimize product adoption and reduce churn.
What’s in the future for product analytics?
If the world around you is dynamic, you can’t be static. It’s the same when it comes to product analytics too. It is not a static entity but a vibrant ecosystem that continually evolves. Personally, I think that the future of product analytics is poised for groundbreaking transformations.
Current trends in product analytics
- Machine learning and predictive analytics: It had to happen, didn’t it? And it did! The marriage of machine learning and product analytics is not just a trend; it’s a revolution. As machine learning algorithms become more sophisticated, they are changing how we interpret data. A future where your analytics platform not only tells you what happened but also predicts what might happen based on intricate patterns and user behaviors is not too far away. This trend is not merely about keeping up; it’s about staying ahead of the curve.
- Cross-platform analytics: With the rapi growth of digital touchpoints, the future kinda demands analytics that are platform agnostic. The trend is towards holistic cross-platform analytics that seamlessly integrates data from web, mobile, and emerging channels. This approach ensures a comprehensive understanding of user journeys, irrespective of the device or medium they choose. It’s about breaking down the silos and seeing the complete bigger picture.
- Ethical data practices: Where there is so much data, there has yto be ethical conundrums. As the importance of data ethics gains prominence, the future of product analytics embraces a commitment to responsible data practices. This involves not just complying with regulations but going beyond to ensure user privacy, consent, and transparency.
- Customization and personalization: The one-size-fits-all approach has become obsolete. The future belongs to analytics platforms that allow for extensive customization and personalization. Product owners want dashboards tailored to their unique needs, displaying the metrics and insights that matter most to them.
The future of product analytics
The future of product analytics promises to be interesting, to say the least. It will not be merely an accumulation of trends but a holistic transformation of how we perceive, interact with, and derive value from data. Here’s what you can expect -
- Augmented analytics: The merger of human intuition and machine intelligence is the crux of augmented analytics. The future of analytics platforms might not be as mere tools but as intelligent assistants that collaborate with users. Product Analytics of the future may not just present data, they will engage in conversations, answer questions, and provide insights in a natural language interface.
- Data democratization: The future is about breaking down the barriers to data access and interpretation. Data democratization envisions a landscape where every team member, regardless of their technical prowess, can engage with analytics. This evolution transforms analytics from a specialized function to a universal language spoken across all departments. It’s all about breaking down the silos. It’s about creating that single source of truth (SSOT).
- Continuous intelligence: In a world that never sleeps, the future demands intelligence that never rests. Continuous intelligence is the concept of having real-time analytics that not only respond to events but also proactively suggest actions. It’s the transition from reactive decision-making to a continuous loop of analysis and refinement.
Wrapping up
After traversing through the history of product analytics, one thing that has become clear is that it has a great past, it is the present and it definitely will shape the future. The future of product analytics is not a distant destination but in fact it is a journey that we are on today. As trends shape the landscape and transformations redefine our approaches, product innovators must stay adaptive and forward-thinking.
The call to action is clear — embrace the trends, anticipate the transformations, and be architects of the future of product analytics. It’s not a spectator sport anymore; it requires you to have active participation in building a landscape where data becomes a catalyst for innovation and a compass for decision-making. The future awaits, and it’s not just about what’s next; it’s about what we create next.
More resources on Product Analytics
- 10 bestproduct analytics tools
- Empower Product Managers with our no-codeProduct Analytics Tool
- Data-Driven Retail: Exploringecommerce analytics
- The rise and power ofSaaS analytics to drive product growth
- 18 keyproduct analytics metrics every PM should track
- How to create a robustproduct analytics framework?
- Riding the wave: Emergingtrends in product analytics


Top comments (1)
Have you tried warehouse-native?