Community-single Introduction
Community-single is a minimalist version of a community backend service that mainly includes user registration, login, follow-up and other functions, as well as the creation of content (text, images, videos), publishing, commenting, liking, and collecting. These functions are common in various community platforms, video platforms, live broadcast platforms and can be used as a reference for learning, click to see the full project code.
The community-single project was originally designed as a single web service. The entire service was assisted by the code generation tool sponge. During the process of generating web service code with sponge, the business logic and non-business logic code were separated. The non-business logic code here refers to the web service framework code, which mainly includes:
- Encapsulated gin code
- Service governance (logging, rate limiter, circuit breaker, link tracking, service registration and discovery, metric collection, performance analysis, configuration center, resource statistics etc.)
- API interface testing (swagger)
- Compilation and deployment scripts (binary, docker, k8s)
- CI/CD (jenkins)
In addition to the web service framework code, everything else belongs to business logic code.
Sure! Here is the translation of the text you provided:
Consider a complete web service code as an egg. The eggshell represents the web service framework code. The albumen and yolk represent the business logic code. The yolk is the core of the business logic (the code that needs to be written manually), such as defining MySQL tables, defining API interfaces, and writing specific logic codes. The albumen is the bridge that connects the core business logic code with the web framework code (automatically generated without manual coding), such as registration routing code generated based on proto files, handler method function code, parameter verification code, error codes, Swagger documents, etc. The web service egg model analysis diagram is shown in the figure below:
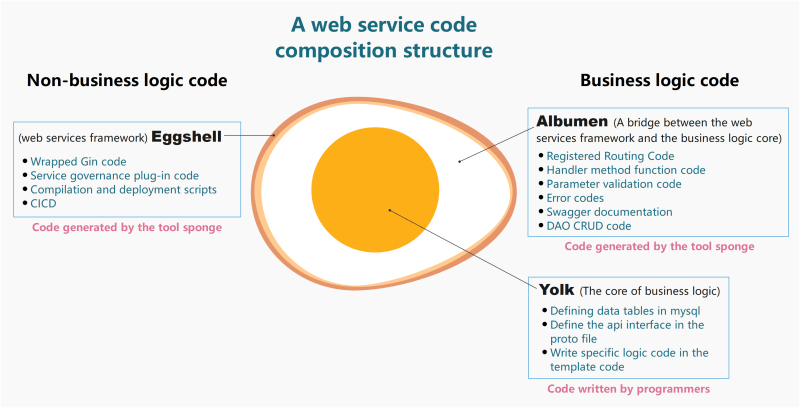
Therefore developing a complete web service project focuses on defining data tables, defining api interfaces, and writing specific business logic code in template code. These are 3 nodes which are also the core code of business logic (yolk). Other codes (eggshell and albumen) are generated by sponge which can help you write less code. Below is an introduction to the development process from 0 to completion of the project.
The development process relies on the sponge tool and requires sponge to be installed first. Click to view installation instructions.
Define data tables and API interfaces
According to the business requirements, the data table and api interface should be defined first, which is the core of the business logic code, and later the code needs to be generated based on the data table and api interface (IDL).
Define data tables
This is the mysql table that has been defined community.sql
Define API interfaces
Define the api interface, input and output parameters, routing, etc. in the proto file. The following is the proto file for the already defined api interface:
It is unlikely that all the mysql tables and API interfaces required for the business will be defined at once during development. Adding or changing is a common occurrence. After modifying the mysql table and proto file, how to synchronize updates to the code will be introduced in the Writing Business Logic Code section below.
Generate project code
After defining the data tables and API interfaces, generate web service project code based on the proto file in sponge's interface. Enter sponge's UI interface, click on the left menu bar 【protobuf】--> 【Web type】-->【Create web project】, fill in relevant parameters to generate web project code as shown below:
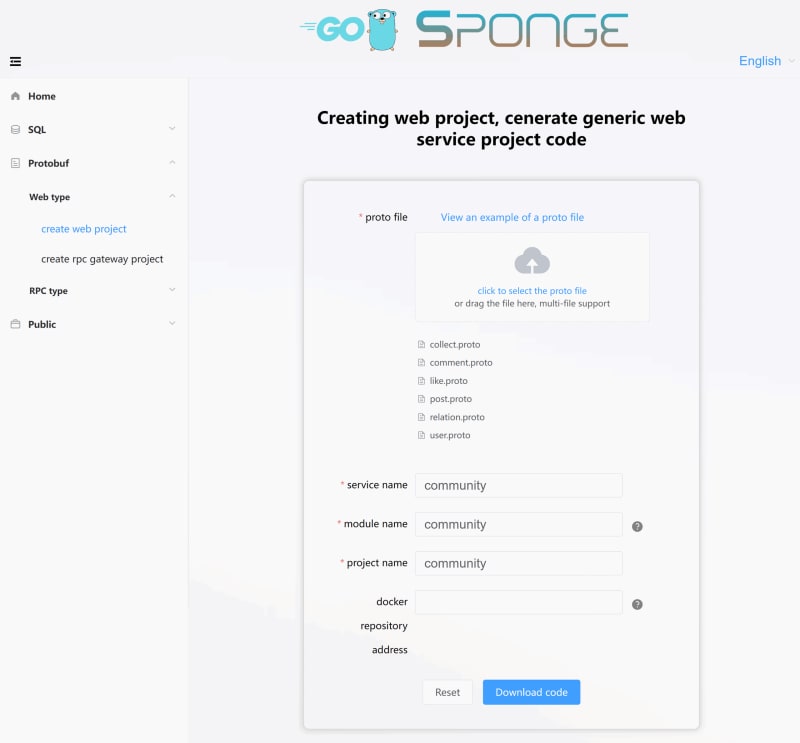
Unzip the code and change the folder name (e.g., community-single). A service only needs to generate code once. In this way, a basic framework for building a web service is completed with one click. Next, you can write business logic code within the web service framework.
Writing Business Logic Code
After being stripped by sponge, business logic code only includes two parts: proto files and mysql tables. Writing business logic code is basically carried out around these two parts.
Write business logic code related to proto files
Enter the community-single project directory, open the terminal and execute the command:
make proto
This command generates four parts of code: interface template code, registration route code, API interface error code and swagger document.
(1) Generated interface template code, located in internal/handler directory. The file name is consistent with the proto file name and the suffix is _login.go. The names are:
collect_logic.go, comment_logic.go, like_logic.go, post_logic.go, relation_logic.go, user_logic.go
In these files, method functions correspond one-to-one with rpc method names defined in proto files. By default, each method function has a simple usage example. You only need to write specific logic codes in each method function. The above codes are codes that have been written with specific logic.
(2) Generated registration route code, located in internal/routers directory. The file name is consistent with the proto file name and the suffix is _handler.pb.go. The names are:
collect_handler.pb.go, comment_handler.pb.go, like_handler.pb.go, post_handler.pb.go, relation_handler.pb.go, user_handler.pb.go
In these files, middleware for setting up api interfaces such as jwt authentication can be set up. The middleware code template for each interface already exists and only needs to uncomment the code to make it effective. Middleware can be set up for both route groups and individual routes.
(3) Generated interface error codes, located in internal/ecode directory. The file name is consistent with the proto file name and suffix is _http.go. The names are:
collect_http.go, comment_http.go, like_http.go, post_http.go, relation_http.go, user_http.go
In these files, default error code variables correspond one-to-one with rpc method names defined in proto files. Add or change business-related error codes here. Note that error codes cannot be repeated otherwise it will trigger panic.
(4) Generated swagger document, located in docs directory with name apis.swagger.json.
If you add or change an API interface in the proto file, you need to execute the make proto command again to update the code. You will find that code files with a date-time suffix appear in the internal/handler, internal/routers, and internal/ecode directories. Open the file and copy the added or modified part of the code into the code of the same name. After copying the new code, execute the make clean command to clear these date-suffix files.
The code generated by the make proto command is used to connect web framework code and business logic core code, that is, the protein part. The advantage of this layered code generation is to reduce coding.
Writing business logic code related to MySQL tables
The previously generated web service framework code and part of the business logic code generated according to the proto file do not include operations on MySQL tables. Therefore, it is necessary to generate dao (data access object) code according to MySQL tables. Dao code includes CRUD code for tables, cache code, and model code.
Enter the sponge UI interface, click on 【Public】--> 【Generate dao CRUD code】 in the left menu bar, fill in relevant parameters to generate dao code, as shown below:
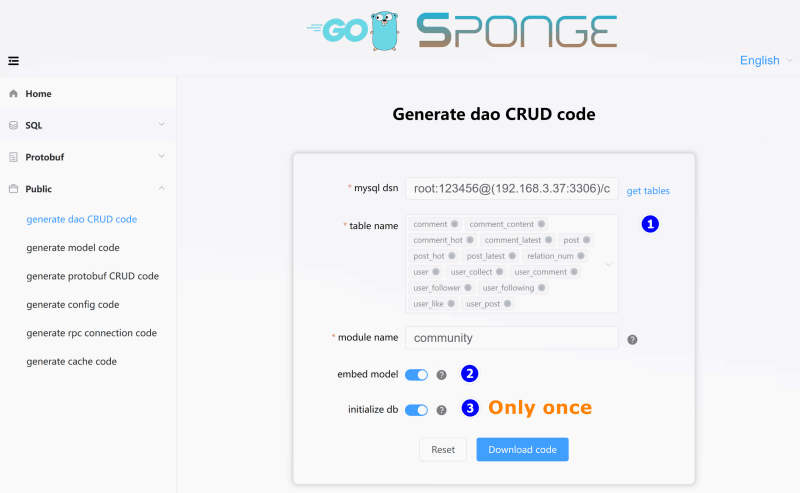
Unzip the dao code and move the internal directory to the community-single directory. This completes adding CRUD operation interfaces for MySQL tables. When new MySQL tables are added, you need to specify MySQL tables to generate dao code again.
There are three parts to specifying dao codes generated by MySQL tables.
(1) Generate model code, in the internal/model directory, file names are consistent with MySQL table names, respectively:
comment.go, commentContent.go, commentHot.go, commentLatest.go, post.go, postHot.go, postLatest.go, relationNum.go, user.go, userCollect.go, userComment.go, userFollower.go, userFollowing.go, userLike.go, userPost.go
This is generated go structure code corresponding to gorm.
(2) Generate cache code, in files under the internal/cache directory, file names are consistent with MySQL table names, respectively:
comment.go, commentContent.go, commentHot.go, commentLatest.go, post.go, postHot.go, postLatest.go, relationNum.go, user.go, userCollect.go, userComment.go, userFollower.go, userFollowing.go, userLike.go, userPost.go
During the process of writing business logic codes, caches may be used to improve performance. Sometimes default caches (CRUD) for tables cannot meet requirements and additional cache codes need to be added. Sponge supports one-click generation of cache codes. Click on 【Public】--> 【Generate cache codes】 in the left menu bar, fill in parameters to generate codes, then move the unzipped internal directory to community-single directory and directly call cache interfaces in business logic.
(3) Generate dao codes, in files under internal/dao directory, file names are consistent with MySQL table names respectively:
comment.go, commentContent.go, commentHot.go, commentLatest.go, post.go, postHot.go, postLatest.go, relationNum.go, user.go, userCollect.go, userComment.go, userFollower.go, userFollowing.go, userLike.go, userPost.go
During writing business logic codes, it will involve operating on MySQL tables. Sometimes default operations (CRUD) cannot meet requirements. At this time, custom functions and implementation codes for operating on MySQL tables need to be manually written. For example comment.go and post.go contain a small number of manually defined function methods for operating on msyql tables.
During development process sometimes MySQL tables will be modified or added. Codes generated based on MySQL tables need to be synchronized into project codes and handled in two situations:
- After modifying MySQL table update codes: Just generate new model codes based on modified table and replace old model codes. Click on 【Public】--> 【Generate model codes】 in left menu bar, fill in parameters, select changed mysql table then move unzipped internal directory to community-single directory and confirm replacement.
- After adding new mysql table: Just generate new dao codes based on added table and add them into project directory. Click on 【Public】--> 【Generate dao codes】 in left menu bar, fill in parameters, select added mysql table then move unzipped internal directory into community-single directory.
Testing API interface
After writing the business logic code, start the service to test the API interface. Before starting the service for the first time, open the configuration file (configs/community.yml) to set the MySQL and Redis addresses, and then execute the command to compile and start the service:
# Compile and run service
make run
Visit http://localhost:8080/apis/swagger/index.htm in your browser to enter the swagger interface, as shown below:
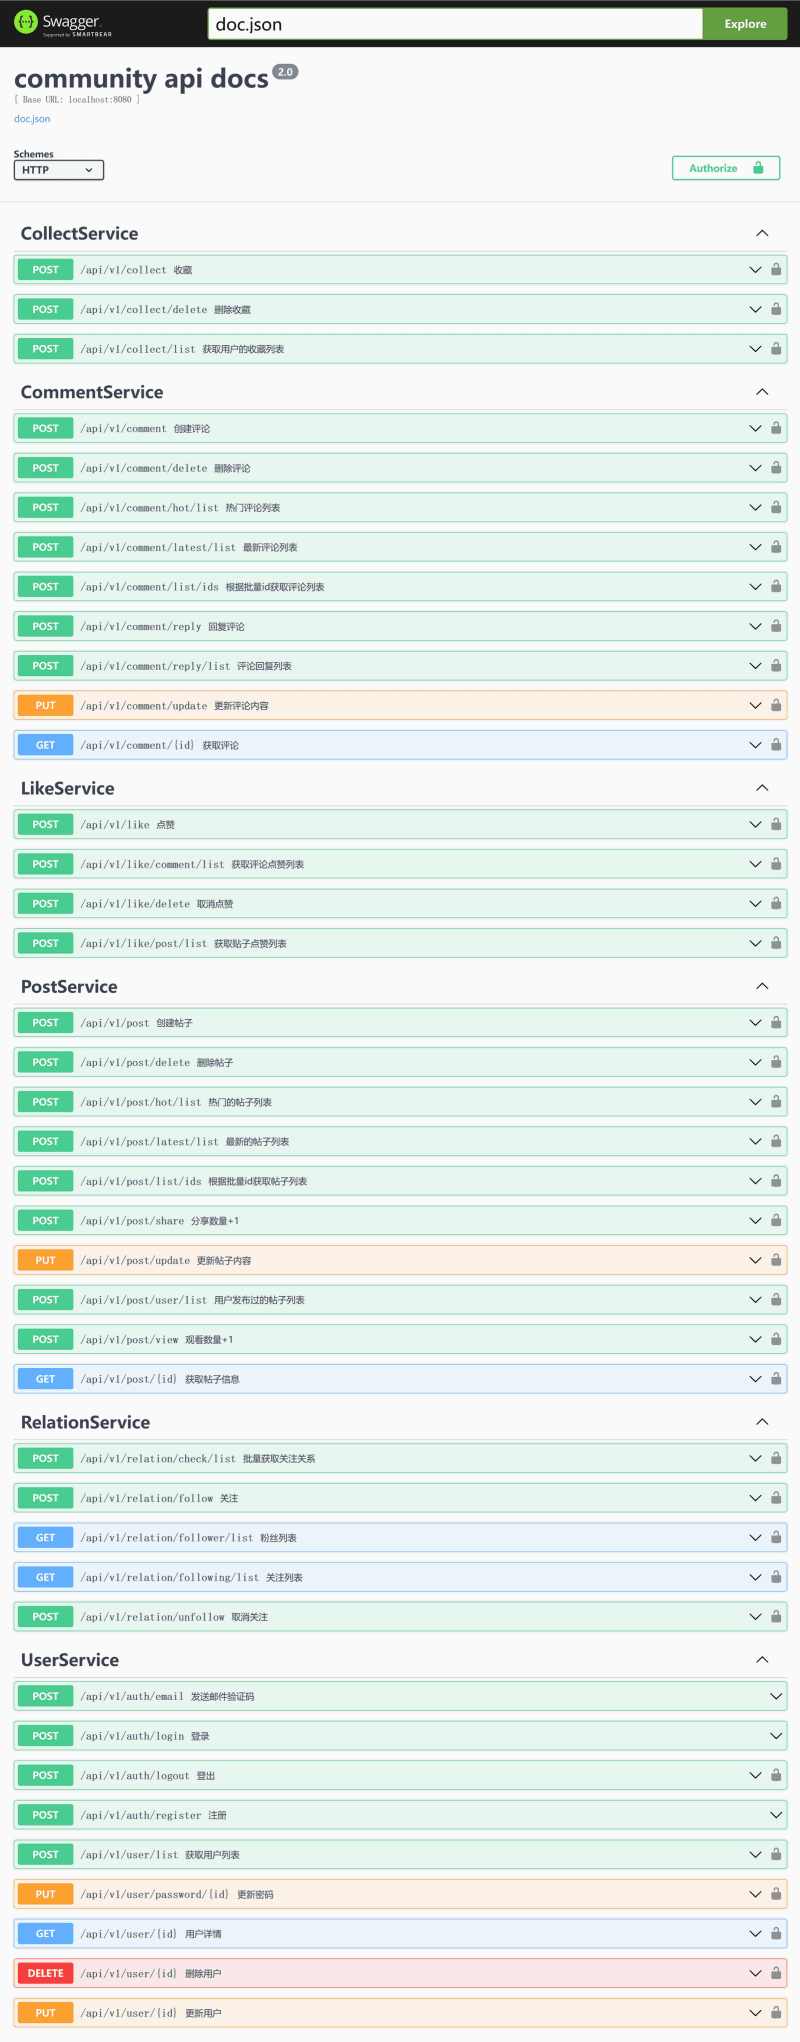
From the picture, you can see that some API interfaces have a lock mark on the right side, indicating that the request header will carry authorization information Authorization. Whether the server receives a request for authentication is determined by the server. If the server needs to authenticate, it can be set in each internal/routers/xxx_handler.pb.go file, that is, canceling the commented code for authentication and enabling the authentication middleware for the API interface.
Service governance
The generated web service code contains rich service governance plugins. Some service governance plugins are closed by default and can be turned on as needed. They are uniformly set in the configuration file configs/community.yml.
In addition to the service governance plugins provided by web services, you can also use your own service governance plugins. It is recommended to introduce your own service governance plugins in internal/routers/routers.go.
Log
The log plugin is enabled by default and outputs to the terminal by default. The default output log format is console. You can set the output format to json and set logs to be saved to a specified file. Set log file cutting and retention time.
Set in field logger in configuration file:
# logger settings
logger:
  level: "info"             # Output log level debug, info, warn, error, default is debug
  format: "console"     # Output format, console or json, default is console
  isSave: false           # false: output to terminal, true: output to file, default is false
  logFileConfig:          # effective when isSave=true
    filename: "out.log"            # File name, default value out.log
    maxSize: 20                     # Maximum file size (MB), default value 10MB
    maxBackups: 50               # Maximum number of old files retained, default value 100
    maxAge: 15                     # Maximum number of days old files are retained, default value 30 days
    isCompression: true          # Whether to compress/archive old files, default value false
Rate limiter
The rate limiter plugin is closed by default and adaptive rate limiter does not require setting other parameters.
Set in field enableLimit in configuration file:
enableLimit: false # Whether to enable rate limiter (adaptive), true: enable, false: close
Circuit breaker
The circuit breaker plugin is closed by default and adaptive circuit breaker supports custom request return error codes (default 500 and 503) for circuit breaking. Set in internal/routers/routers.go.
Set in field enableCircuitBreaker in configuration file:
enableCircuitBreaker: false # Whether to enable circuit breaker (adaptive), true: enable, false: close
Link tracking
The link tracking plugin is closed by default and link tracking depends on jaeger service.
Set in field enableTrace in configuration file:
  enableTrace: false    # Whether to enable tracking, true: enable, false: close. If it is true, jaeger configuration must be set.
  tracingSamplingRate: 1.0      # Link tracking sampling rate range from 0~1.0 floating point number. 0 means no sampling and 1.0 means sampling all links.


# jaeger settings
jaeger:
  agentHost: "192.168.3.37"
  agentPort: 6831
View link tracking information on jaeger interface document description.
Service registration and discovery
The service registration and discovery plugin is closed by default and supports three types of consul etcd nacos.
Set in field registryDiscoveryType in configuration file:
  registryDiscoveryType: ""    # Registration and discovery type: consul, etcd, nacos. If it is empty, it means that service registration and discovery are closed.


# Set parameters according to the value of field registryDiscoveryType. For example, if you use consul as service discovery, you only need to set consul.
# consul settings
consul:
  addr: "192.168.3.37:8500"

# etcd settings
etcd:
  addrs: ["192.168.3.37:2379"]

# nacos settings
nacosRd:
  ipAddr: "192.168.3.37"
  port: 8848
  namespaceID: "3454d2b5-2455-4d0e-bf6d-e033b086bb4c" # namespace id
Metric collection
The metric collection function is enabled by default and provides data for prometheus to collect. The default route is /metrics.
Set in field enableMetrics in configuration file:
enableMetrics: true # Whether to enable metric collection, true: enable, false: close
Use prometheus and grafana to collect metrics and monitor services document description.
Performance Analysis
The performance analysis plugin is turned off by default, and the default route for collecting profiles is /debug/pprof. In addition to supporting the default profile analysis provided by the Go language itself, it also supports IO analysis, with the route being /debug/pprof/profile-io.
The enableHTTPProfile field is set in the configuration file:
enableHTTPProfile: false # Whether to enable performance analysis, true: enabled, false: disabled
The way to collect profiles through routes for performance analysis is usually used during development or testing. If it is turned on online, there will be a little bit of performance loss because the program records profile-related information regularly in the background. The web service generated by sponge has made some improvements. Normally, it stops collecting profiles. When the user actively triggers a system signal, it starts and stops collecting profiles. The collected profiles are saved to /tmp/serviceName_profile directory. The default collection is 60 seconds. After 60 seconds, it automatically stops collecting profiles. If you only want to collect for 30 seconds, send the first signal to start collecting, and then send the second signal after about 30 seconds to stop collecting profiles, similar to a switch.
These are the steps to collect profiles:
# View service pid by name
ps aux | grep service name

# Send signal to service
kill -trap pid value
Note: Only supports Linux and Darwin systems.
Resource Statistics
The resource statistics plugin is turned on by default and outputs statistics to the log once per minute by default. Resource statistics include both system and service-related data for CPU and memory. Resource statistics include automatic profile collection functionality. When the average CPU or memory usage of this service is calculated for 3 consecutive times, and the average CPU or memory usage exceeds 80% of system resources, profile collection is automatically triggered. The default collection time is 60 seconds. The collected profile is saved to /tmp/service name_profile directory, thus achieving adaptive profile collection, which is an improvement over manually sending system signals to collect profiles.
The enableHTTPProfile field is set in the configuration file:
enableStat: true # Whether to enable resource statistics, true: enabled, false: disabled
Configuration Center
Currently supports Nacos as a configuration center, with configuration center file configs/community_cc.yml and configuration content as follows:
# nacos settings
nacos:
  ipAddr: "192.168.3.37"    # server address
  port: 8848                      # listening port
  scheme: "http"               # http or https
  contextPath: "/nacos"     # path
  namespaceID: "3454d2b5-2455-4d0e-bf6d-e033b086bb4c" # namespace id
  group: "dev"                    # group name: dev, prod, test
  dataID: "community.yml"  # config file id
  format: "yaml"                 # configuration file type: json,yaml,toml
And the service's configuration file configs/community.yml is copied to Nacos' interface for configuration. To use Nacos as a configuration center, start the service command with the specified configuration center file as follows:
./community -c configs/community_cc.yml -enable-cc
Documentation on using Nacos as a configuration center.
Continuous Integration and Deployment
The web service generated by sponge includes compilation and deployment scripts. Compilation supports binary compilation and docker image building. Deployment supports binary deployment, docker deployment, and k8s deployment in three ways. These functions are all integrated into the Makefile file and can be easily executed using make commands.
In addition to using make commands for compilation and deployment, Jenkins also supports automated deployment tools. The default Jenkins settings are in the Jenkinsfile file and support automated deployment to k8s. If binary or docker deployment is required, Jenkinsfile needs to be modified.
Documentation on using Jenkins for continuous integration and deployment.
Service Stress Testing
Some tools used when stress testing services:
- http stress testing tools wrk or go-stress-testing.
- Service opens metric collection function, uses prometheus to collect service metrics and system metrics for monitoring.
- The service's own adaptive profile collection function.
Stress testing indicators:
- Concurrency: Gradually increase the number of concurrent users to find the maximum concurrency of the service and determine the maximum number of users the service can support.
- Response time: Pay attention to the average response time and response time distribution of the service when the number of concurrent users increases. Ensure that even under high concurrency, the response time is within an acceptable range.
- Error rate: Observe the probability of errors or exceptions occurring in the service as concurrency increases. Use stress testing tools for long-term concurrent testing and count the number and type of errors at each concurrency level.
- Throughput: Find the maximum throughput of the service and determine the maximum request volume that the service can support under high concurrency. This requires continuously increasing concurrency until the throughput saturation point is found.
- Resource utilization: Pay attention to the utilization rate of resources such as CPU, memory, disk I/O, network, etc. when concurrency increases, and find the resource bottleneck of the service.
- Bottleneck detection: By observing the performance indicators and resource utilization rate of the service under high concurrency, find hardware or software bottlenecks in the system and service for optimization.
- Stability: Long-term high-concurrency operation can detect potential problems in services such as memory leaks and connection leaks to ensure stable operation of services. This requires long-term concurrent stress testing to observe service operation indicators.
Stress testing services is mainly to evaluate their performance, determine their maximum concurrency and throughput, discover current bottlenecks, and detect service stability for optimization or capacity planning.
Summary
This is a practical project using sponge from development to deployment. The specific process is as follows:
- Define mysql table
- Define api interface in proto file
- Generate web framework code based on proto file
- Generate business logic related code based on proto file
- Generate dao code based on mysql table
- Write specific logic code in specified template file
- Test and verify api interface in swagger
- Enable service governance function as needed
- Continuous integration and deployment
- Service stress testing
It seems that there are many processes, but only 1, 2, 6 are three core business processes that require manual coding. The code or scripts involved in other processes are generated by sponge. Using sponge to separate non-business logic code from business logic code allows developers to focus on core business logic code when developing projects while also making project code standardized and uniform so that different programmers can quickly get started. Combined with programming assistance tools such as Copilot or Codeium to write code, project development becomes more efficient and easy.
community-single is a monolithic web service. As the demand increases and the functionality becomes more and more complex, code maintenance and development become difficult. It can be split into multiple microservices. The process of splitting a web monolithic service into microservices only changes the eggshell (web framework changed to gRPC framework) and albumen (http handler-related code changed to rpc service-related code), while the yolk (core business logic code) remains unchanged. The core business logic code can be seamlessly ported to microservice code. In the next article, we will introduce the use of the tool "sponge" to assist in splitting community-single into a microservice cluster.


Top comments (0)