We are excited to release a stable version of React Native ECharts 1.1. In the new version, we have added support for the react-native-gesture-handler gesture solution, among other enhancements. Read on to learn more!
@wuba/react-native-echarts, An awesome charting library for React Native, built upon Apache ECharts and leveraging react-native-svg and react-native-skia. Offers significantly better performance compared to WebView-based solutions. If you want to learn more about the project's design principles, you can click here.
To provide a more intuitive and accurate understanding of the project's features, we have decided to officially rename the initial version wrn-echarts to @wuba/react-native-echarts. In the new version.
The project source code is available at https://github.com/wuba/react-native-echarts.
Features
Rich Chart Types Supported
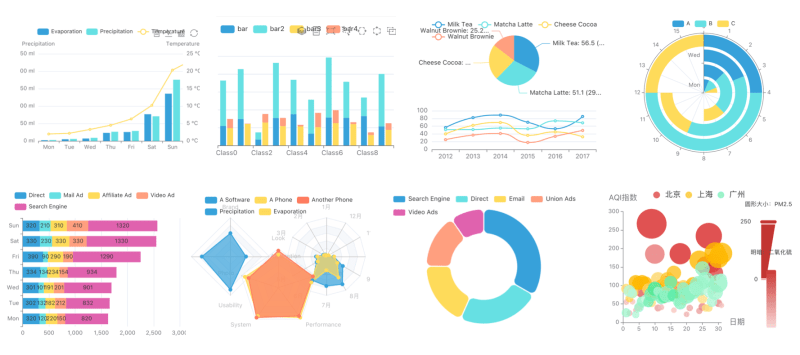
@wuba/react-native-echart is a solution that brings the ECharts charting library into React Native applications. It utilizes the rendering capabilities of React Native's native components, resulting in a significant improvement in rendering speed. It supports a wide range of commonly used chart types, including line charts, area charts, bar charts, and scatter plots, as well as more complex charts such as candlestick charts and heat maps. It can fulfill various visualization requirements in different scenarios.
Here are some examples of common chart types:
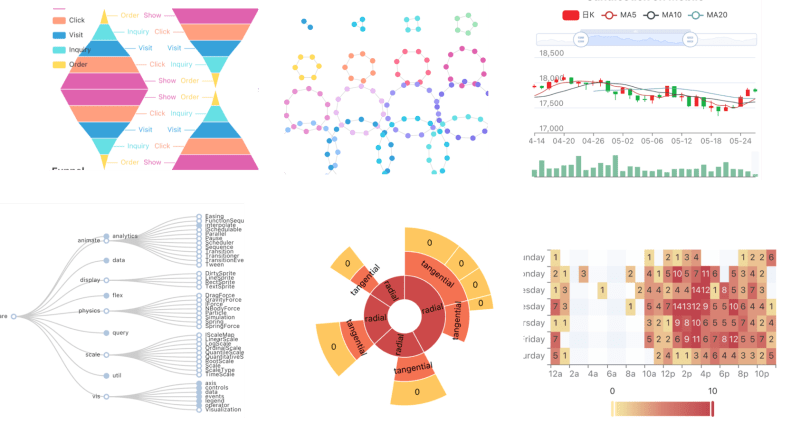
In addition to the usual chart types, @wuba/react-native-echart supports a variety of other graphs, such as tree, heat and K-line charts, with excellent rendering performance.
In addition, we provide comprehensive support for various dynamic charts, and here are some examples. Chart 1 and Chart 2 demonstrate the dynamic changes in per capita income across multiple countries. Chart 1 presents the growth trend of per capita income over the past 70 years, while Chart 2 showcases the dynamic sorting of per capita income for 10 countries in the year 1982. Chart 3 displays a continuously updated speedometer that adapts to changing values over time, and Chart 4 demonstrates a dynamic node addition chart. These charts can dynamically re-render based on evolving data. Regardless of the data update frequency, they consistently deliver outstanding rendering performance.
@wuba/react-native-echart supports a wide range of chart types, but they are too numerous to display here. If you want to explore more comprehensive chart types, you can visit the taro-playground repository to check them out. There, you will find example demos showcasing various ECharts chart types.
Svg and Skia Supported
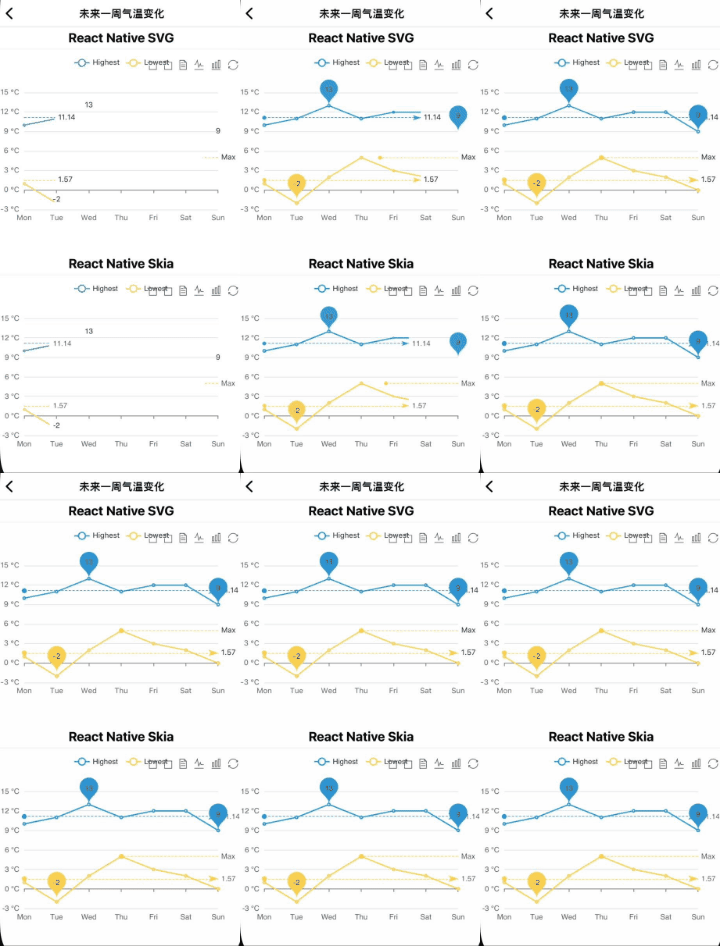
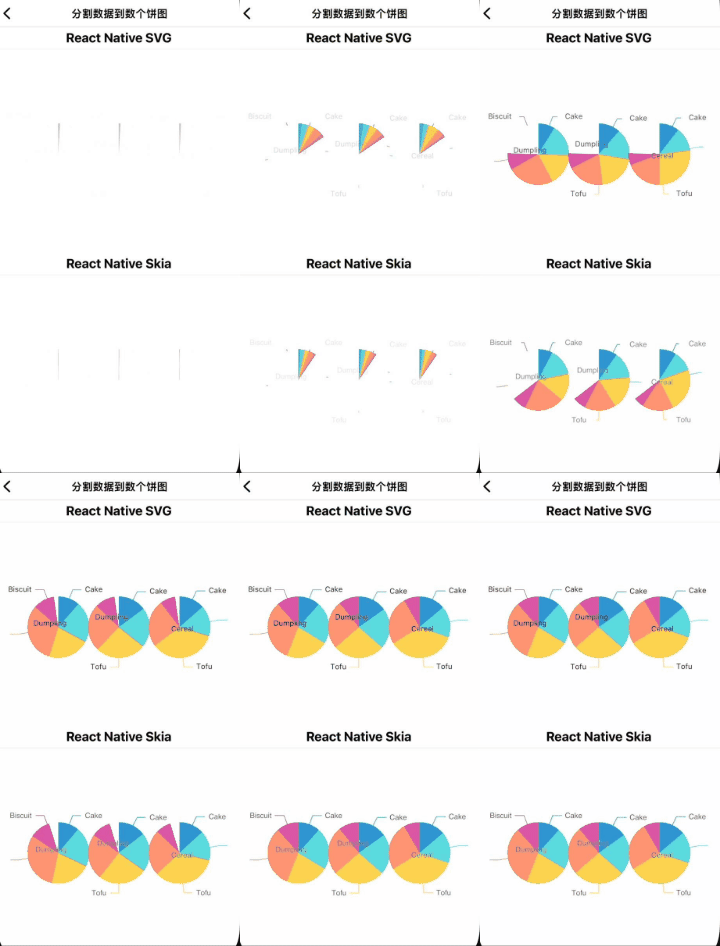
@wuba/react-native-echart supports two rendering modes: Svg and Skia. It is implemented based on react-native-svg and react-native-skia. How do you choose between the two rendering modes? From the perspective of rendering speed, Svg and Skia have similar performance, as shown in the following figure. However, it's important to note that Skia rendering has some limitations in terms of Chinese language support. To display Chinese characters correctly, you need to set up fonts separately. Therefore, when choosing a rendering library, please consider the language requirements of your project and the importance of Chinese language support. We recommend selecting the appropriate rendering mode based on specific circumstances to achieve optimal performance and user experience.
Support various gestures
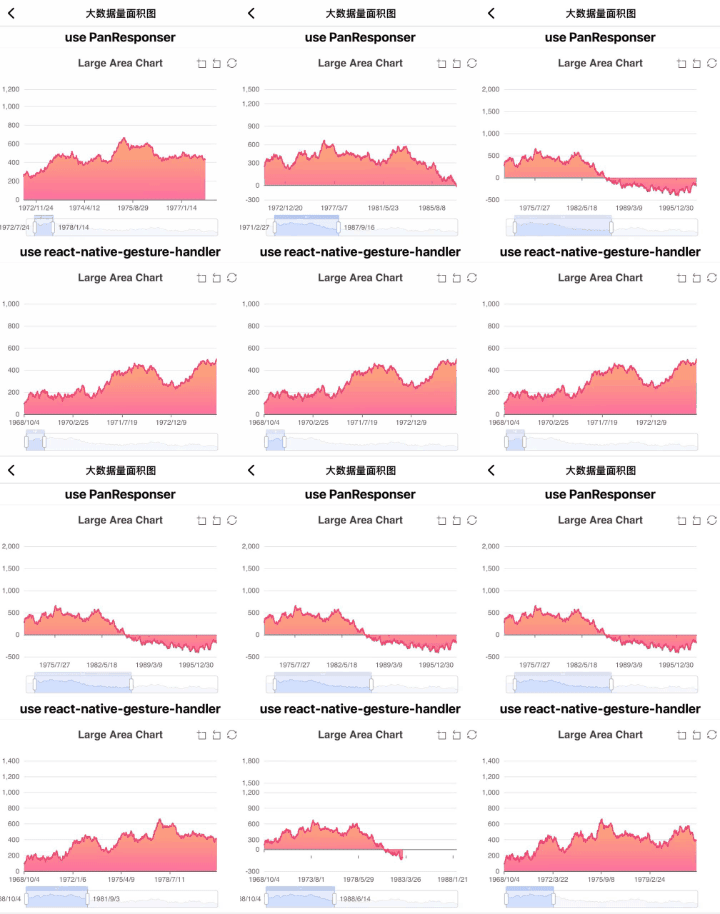
Support for various gestures such as tapping, dragging, and scaling is available. By default, we use the built-in PanResponder from React Native to handle these gestures. Starting from version 1.1, we have added support for the react-native-gesture-handler library. If you have already integrated this gesture library into your project, we recommend using it directly to handle gestures for enhanced performance and user experience.
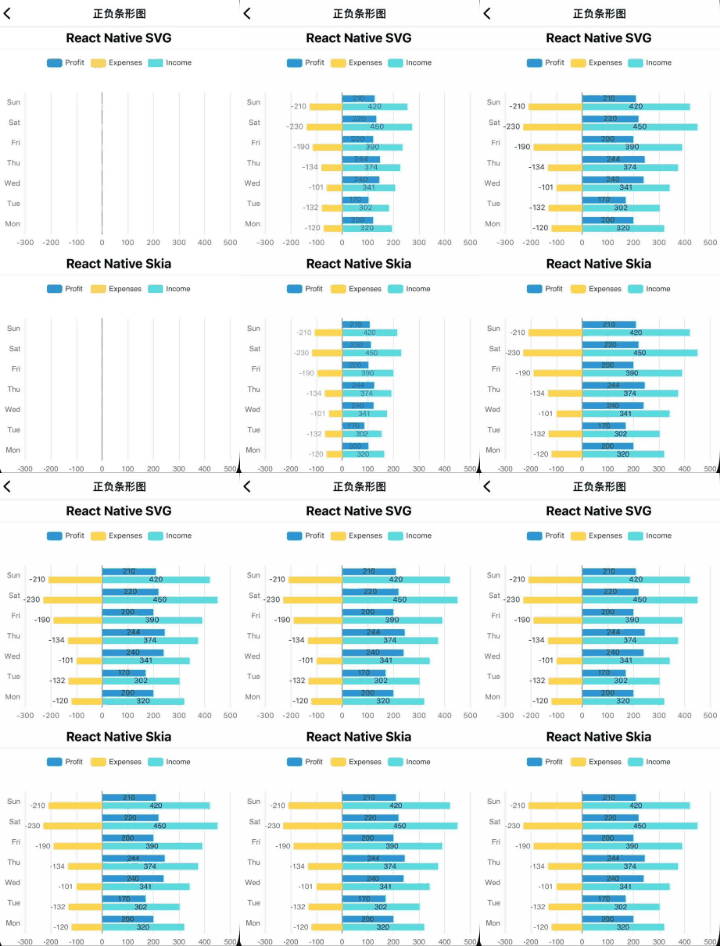
Below is a comparison of the two gesture solutions. Judging from the smoothness of chart scrolling, both the default gesture handling and the use of react-native-gesture-handler provide excellent fluidity. You can choose the approach that best suits your needs.
Web Support
We also support reusing the components of @wuba/react-native-echart in the web environment to meet cross-platform requirements and achieve code sharing across multiple platforms. This enables easy code unification, ensures consistency of charts across different platforms, and enhances our development efficiency.
ECharts, the charting library, provides a wide range of online rendering examples for the web. But how well does it perform on React Native? To address this, we offer corresponding online preview and testing support. You can directly copy the chart configuration to see how it renders on React Native. Online preview click here
Roadmap
Despite our already extensive and well-rounded support for ECharts, we are committed to further optimizing and enhancing it. In our upcoming work, we will focus on improvements and enhancements in the following areas to deliver even more refined functionality. Click here to see more detailed information and progress updates.
Performance Enhancement
Compared to the rendering solution using Webview, @wuba/react-native-echart has achieved significant improvements in overall rendering performance. However, there is still room for further improvement in rendering speed and memory usage when dealing with large data sets. We are committed to optimizing performance in handling large data sets to ensure exceptional performance and stability in various complex data scenarios.
Known Issue Fixes
Currently, the support for the ECharts charting library is very comprehensive. However, there are still some issues that need to be improved in some chart rendering, such as not supporting map display and incorrect image display in Skia rendering mode. We take these issues very seriously and will continue to work on fixing them. to provide a better chart presentation experience.
ECharts GL Supported
With the widespread application of 3D visualization in various business scenarios, such as the displayed 3D chart below, we will continue to explore and enhance our support for ECharts GL to meet more business needs. You can click here to check the latest progress.
Improve the Infrastructure
In the future, we will continue to improve the infrastructure by refining test cases, adding user use cases and other content. Standardized test cases can check whether any changes made during the development process have an impact on other functions. We will gradually add more test cases, standardize the code and improve the quality of the code.
Acknowledgments
We are deeply grateful to all our friends in the @wuba/react-native-echarts open-source community. Whether you have contributed to the codebase, provided bug reports along with contextual information, or shared ideas to enhance existing features, your contributions have been incredibly valuable to this project. We wholeheartedly welcome you to join us and actively participate in the project's discussions and collaborative development.
Lastly, we would like to express our special thanks to the developers who have contributed to the project's success:
Author: yechunxi






Top comments (1)
good